Understanding Pumps & Compressors Efficiency Loss vs. Power Waste
Efficiency loss in Pumps & Compressors represents one of the most expensive yet overlooked maintenance issues in industrial operations. Unlike dramatic failures that demand immediate attention, gradual efficiency degradation often goes unnoticed until power consumption becomes unsustainable. At 3G Electric, with over 35 years of experience distributing industrial equipment globally, we've documented that efficiency losses typically precede major failures by 2-4 months, making early detection critical.
The distinction between efficiency loss and power waste is fundamental. Efficiency loss occurs when a pump or compressor requires more energy to produce the same output as when new. Power waste, conversely, indicates the system is consuming energy without productive output—friction losses, internal leakage, or bypass flow consuming 15-40% of input power in degraded units.
Maintenance teams must understand that a pump consuming 15 kW while delivering 60% of its rated flow rate signals efficiency loss, but a pump consuming 18 kW while delivering the same 60% flow rate indicates accelerating internal degradation. This comparison reveals whether you're facing component wear or systemic problems requiring immediate intervention.
Comparative Diagnostic Methods: Identifying Your Specific Problem
Power Consumption Analysis vs. Flow Rate Measurement
Traditional troubleshooting often relies solely on flow rate measurement, which is incomplete. A more effective approach compares power input against volumetric output using the efficiency equation:
Theoretical Power (kW) = (Flow Rate × Pressure) / 600
Actual Efficiency (%) = (Theoretical Power / Measured Power Input) × 100
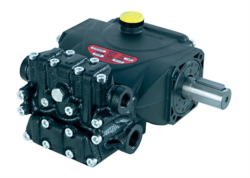
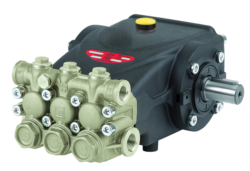
For example, comparing Interpump PUMP E3B2515I R against Interpump PUMP E3B2515 L, both rated for 25 L/min at 150 bar:
- Expected theoretical power: (25 × 150) / 600 = 6.25 kW
- Right model (E3B2515I-000) actual consumption: 7.2 kW = 86.8% efficiency (acceptable)
- Left model (E3B2515S-000) actual consumption: 9.1 kW = 68.6% efficiency (degraded)
This comparison immediately identifies that the left-side unit has lost 18.2 percentage points of efficiency, while visual inspection alone would reveal nothing.
Temperature Signature Comparison
Pumps & Compressors experiencing efficiency loss generate excess heat through internal friction. Comparing discharge temperature against historical baseline data reveals degradation stage:
- Stage 1 (Early): +5-10°C above baseline = worn internal seals
- Stage 2 (Moderate): +10-15°C above baseline = bearing wear + seal degradation
- Stage 3 (Critical): +15-25°C above baseline = imminent failure risk
Measure discharge temperature weekly and plot trends. A pump showing 5°C increase over 6 weeks versus one showing 5°C increase over 2 weeks requires different intervention strategies—the latter needs urgent component replacement.
Acoustic Analysis Comparison
Sound frequency patterns distinguish between different degradation mechanisms:
- Cavitation noise = high-frequency pinging/crackling (500-2000 Hz)
- Bearing wear noise = irregular grinding/knocking (100-400 Hz)
- Seal degradation noise = steady whining/whistling (200-800 Hz)
- Gear wear noise = rhythmic clicking (synchronized with shaft rotation)
Using ultrasonic meters (20-40 kHz range) on Interpump PUMP E3B1515 DX*VALV.DX + GEARBOX RS500H, baseline acoustic signatures at installation provide critical reference points. Comparing current readings against stored baselines identifies specific component failures before catastrophic breakdown.
Root Cause Identification: When to Replace vs. When to Repair
Seal and Bearing Degradation Pathway
Internal leakage through worn seals is the primary efficiency killer in Pumps & Compressors. The challenge for maintenance teams is determining whether seal failure justifies replacement or repair intervention.
Comparison framework for seal assessment:
1. Measure case drain flow rate (fluid returning from pump casing to reservoir)—normal range is 0.5-2 L/min depending on pump type
2. Compare against baseline documentation—if baseline shows 1.2 L/min and current measurement shows 3.8 L/min, internal seal leakage has increased 216%
3. Assess seal age and usage hours—standard industrial seals last 3000-5000 hours; seals beyond 4500 hours showing elevated case drain flow warrant replacement
For Interpump PUMP E3C1021 DXV.DXNO.C/J, typical seal degradation manifests as:
- Months 0-18: Case drain remains stable at design spec
- Months 18-36: 10-20% case drain increase = early wear
- Months 36+: >30% case drain increase = replacement recommended
Bearing wear creates a different efficiency pattern. Comparing power consumption at identical pressure and flow against baseline shows whether efficiency loss is linear (seal wear = consistent efficiency reduction) or accelerating (bearing wear = exponentially increasing power demand).
Inlet Pressure and Suction Conditions
Often overlooked, suction-side conditions dramatically affect measured efficiency. Comparing system performance across different inlet pressures reveals whether problems originate upstream or within the pump itself.
Test procedure:
1. Operate pump with inlet pressure at 0.3 bar (typical) and record power consumption at 60 bar discharge
2. Increase inlet pressure to 0.8 bar (if system allows) and repeat measurement
3. Calculate efficiency at both conditions
If efficiency improves significantly with higher inlet pressure, the problem is cavitation or inlet restriction, not pump degradation. If efficiency remains poor regardless of inlet pressure, internal wear (seals, bearings, or impellers) is the culprit.
Viscosity Effects on Efficiency Comparison
Fluid viscosity variations cause apparent efficiency loss without actual component degradation. Comparing performance across temperature ranges isolates this variable:
- Winter operation at 32°C: ISO 46 fluid reaches 95 cSt viscosity
- Summer operation at 52°C: Same fluid drops to 42 cSt viscosity
- Power consumption change: 15-22% variance due to viscosity alone
Maintenance teams using Interpump PUMP E3C1515 L must compare efficiency measurements only when fluid temperature stays within ±5°C ranges, otherwise attributing viscosity-related power changes to component wear leads to unnecessary replacements.
Maintenance Strategy: Prevention vs. Reactive Intervention
Establishing Baseline Efficiency Benchmarks
The most critical action for maintenance teams is establishing performance baselines within 100 operating hours of new equipment installation. Document:
- Discharge pressure, flow rate, and power consumption at three load levels (50%, 75%, 100% of rated capacity)
- Fluid temperature, inlet pressure, and case drain flow rate
- Acoustic signatures and vibration readings
- Date, time, ambient temperature, and fluid batch number
Without baselines, identifying efficiency loss becomes guesswork. With documented baselines, even subtle 8-12% efficiency reductions become immediately visible.
Predictive Maintenance Intervals Based on Efficiency Trends
Rather than following generic maintenance schedules, tier maintenance frequency to efficiency degradation rate:
Efficiency Maintained >95% → Standard 2000-hour service intervals
Efficiency Degraded 85-95% → Reduce to 1000-hour intervals; increase oil analysis frequency
Efficiency Degraded 70-85% → 500-hour intervals; plan component replacement within 2-3 weeks
Efficiency <70% → Daily monitoring; schedule immediate replacement or rebuild
This tiered approach prevents premature replacements while avoiding catastrophic failures. A pump operating at 88% efficiency for 6 months costs more in extra energy consumption than a proactive seal kit replacement, but replacing a pump at 95% efficiency wastes capital.
Comparative Cost Analysis: Energy Waste vs. Maintenance Spend
An oversized or degraded pump consuming 3 kW excess power versus optimal operation costs approximately:
Monthly: 3 kW × 720 hours × $0.12/kWh = $259.20 excess cost
Annually: $3,110.40 in wasted energy
Compare this against:
- Seal kit replacement: $800-1200 + 4 labor hours
- Bearing replacement: $1500-2200 + 8 labor hours
- Complete pump rebuild: $3000-5000 + 16 labor hours
For most industrial operations, proactive maintenance becomes cost-justified when efficiency drops below 85%, assuming energy costs exceed $0.10/kWh.
Implementation Checklist for Maintenance Teams
With 35+ years supporting global industrial operations, 3G Electric recommends this systematic approach:
Weekly
- Record discharge pressure, flow rate, and power consumption
- Monitor fluid and discharge temperatures
- Listen for acoustic changes
- Calculate efficiency percentage against baseline
- Review trend data for acceleration or stability
- Measure case drain flow rate
- Analyze oil condition (if sampling protocol active)
- Compare all metrics against baseline documentation
- Assess bearing condition via vibration analysis
- Evaluate whether efficiency trend justifies maintenance intervention
- Review energy cost impact of current efficiency level
1. Verify inlet conditions and baseline parameters unchanged
2. Isolate whether loss is gradual (seals) or accelerating (bearings)
3. Calculate ROI on repair versus replacement
4. Schedule intervention within 2-3 weeks if efficiency <85%
5. Document root cause after repair for future reference
Pumps & Compressors efficiency loss represents preventable operational waste. By implementing comparative diagnostic methods and establishing baseline performance metrics, maintenance teams transform reactive troubleshooting into predictive, cost-effective asset management.