Introduction: Moving Beyond Reactive Maintenance
Pumps & Compressors are the backbone of industrial fluid transfer and pressure systems, yet they remain among the most neglected assets in many facilities. With over 35 years of experience distributing industrial equipment globally, 3G Electric has observed a consistent pattern: maintenance teams typically discover problems only after catastrophic failure occurs. This reactive approach results in unplanned downtime, emergency replacement costs, and potential safety hazards.
The alternative—predictive maintenance—requires understanding the diagnostic signatures of healthy equipment versus deteriorating units. This guide equips maintenance teams with practical diagnostic techniques, sensor-based monitoring strategies, and failure interpretation frameworks that transform how Pumps & Compressors are managed across your operations.
Section 1: Establishing Baseline Diagnostic Protocols
Creating Performance Baselines During Commissioning
The foundation of effective predictive maintenance begins during equipment commissioning, not after problems emerge. When new Pumps & Compressors enter service, maintenance teams must immediately establish baseline performance metrics:
Critical Baseline Measurements:
- Inlet and discharge pressure readings under full load
- Flow rate measurements at operating temperature
- Vibration amplitude and frequency signatures across horizontal and vertical planes
- Acoustic emission profiles (normal operating sound patterns)
- Motor current draw and power consumption
- Bearing temperature readings at multiple points
- Fluid temperature at inlet, outlet, and bearing housing
- Case drain pressure (for pressure-compensated units)
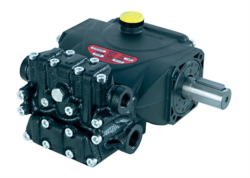
For systems utilizing equipment like the Interpump PUMP E3B2515I R, establish these baselines immediately after installation reaches steady-state operation. Document these measurements in a centralized database—this becomes your reference standard for detecting degradation.
The Digital Maintenance Record Strategy
Modern maintenance relies on structured data collection. Rather than subjective observations, implement systematic measurement protocols:
Weekly Monitoring Tasks:
- Pressure readings at pump inlet and discharge (recorded at same time daily)
- Visual inspection for leakage or fluid seepage
- Listening for unusual acoustic signatures (grinding, cavitation sounds, metal-on-metal contact)
- Temperature measurement at bearing housings and case drain lines
- Vibration analysis using portable equipment (compare against baseline)
- Fluid sampling for contamination analysis and viscosity verification
- Electrical current signature analysis (motor draw trends)
- Thermography of motor, bearing housings, and discharge piping
- Full vibration spectrum analysis (FFT analysis for frequency domain patterns)
- Ultrasonic bearing condition assessment
- Case drain fluid analysis for internal wear particles
- Pressure decay testing to detect internal leakage
When monitoring systems like Interpump PUMP E3B2515 L or Interpump PUMP E3C1515 L, consistent measurement timing proves critical—always take readings under identical operating conditions (same flow rate, temperature, load percentage).
Section 2: Interpreting Diagnostic Signatures and Failure Modes
Vibration Analysis: The Primary Diagnostic Tool
Vibration patterns reveal internal equipment condition before visible symptoms appear. Understanding what different vibration signatures indicate separates proactive maintenance teams from reactive ones.
Normal Operating Vibration:
Healthy Pumps & Compressors exhibit relatively stable, low-amplitude vibration concentrated at the operating frequency (pump speed multiplied by number of pistons or pump displacement). Baseline measurements typically range from 0.2 to 0.5 inches per second (IPS) in the vertical axis for most industrial units.
Cavitation Signature:
When inlet pressure drops below fluid vapor pressure, cavitation occurs—sudden bubble collapse creates distinctive acoustic and vibration signals. Vibration amplitude increases dramatically (often exceeding 1.5 IPS), accompanied by:
- Sharp, crackling acoustic noise
- Pressure fluctuations at discharge
- Localized heating of pump body
- Visible pitting on internal surfaces (discovered during disassembly)
Cavitation typically indicates: inlet line restrictions, inadequate suction pressure, fluid viscosity too low for operating speed, or tank level depletion. Address root causes immediately—cavitation damage accelerates exponentially.
Bearing Wear Signature:
Bearing degradation produces distinctive high-frequency vibration (typically 2-10 kHz range). Unlike cavitation's broad-spectrum noise, bearing wear concentrates energy at specific frequencies:
- Ball pass frequency outer race (BPFO) = bearing repetition frequency
- Ball pass frequency inner race (BPFI) = higher amplitude signature
- Fundamental train frequency (FTF) = cage rotation frequency
These signatures become visible in FFT (Fast Fourier Transform) vibration analysis—peaks emerge at predictable frequencies based on bearing geometry. The key diagnostic indicator: sideband energy increases around these frequencies as bearing preload increases from wear.
Internal Leakage (Worn Pistons/Cylinders):
Internal component wear reduces volumetric efficiency—discharge pressure may remain acceptable, but flow output decreases measurably. Diagnostic indicators:
- Lower discharge flow rate (5-15% decline indicates moderate wear)
- Elevated case drain line pressure and flow
- Gradual discharge pressure rise required to maintain system pressure
- Higher fluid temperature (friction from internal bypassing)
- Reduced vibration amplitude in some frequency bands
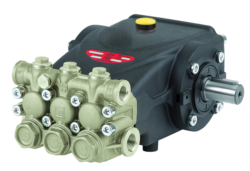
For systems utilizing multi-piston units like Interpump PUMP E3B1515 DX*VALV.DX + GEARBOX RS500H, volumetric efficiency decline becomes the primary diagnostic indicator of piston/cylinder wear.
Pressure Decay Testing: Detecting Internal Leakage Quantitatively
When suspecting internal wear, conduct systematic pressure decay tests:
Procedure:
1. Operate pump at full pressure with discharge line valve closed (building maximum pressure)
2. Record initial discharge pressure reading
3. Isolate pump from load (close discharge valve)
4. Monitor pressure decay over 5-minute interval with pump motor running
5. Calculate pressure decline rate: (Initial Pressure - Final Pressure) / Time
Interpretation:
- Decay less than 1 bar per minute = acceptable internal leakage
- Decay 1-5 bar per minute = moderate wear, plan replacement within 6 months
- Decay greater than 5 bar per minute = severe wear, schedule immediate replacement
This quantitative approach removes guesswork from failure prediction and justifies maintenance budgeting to management.
Section 3: Fluid Analysis as Predictive Intelligence
Oil Analysis: Reading the Story Your Equipment Tells
Fluid condition provides unprecedented insight into internal equipment degradation. Regular oil sampling creates a trend analysis capability that predicts failures weeks or months in advance.
Essential Oil Analysis Parameters:
Viscosity Monitoring:
Viscosity changes indicate contamination, oxidation, or fluid type adulteration. Viscosity trending (measuring same fluid over time) reveals:
- Oxidation rate acceleration = approaching fluid change interval
- Water contamination = viscosity typically decreases slightly
- Viscosity index degradation = system overheating or contamination
Maintain viscosity within ±10% of original specification. Outside this range, fluid thermal and lubrication properties degrade significantly.
Particle Count Analysis (ISO 4406 Standard):
Particle count (measured in microns) reveals wear intensity and contamination ingress. Standard reporting: particles >4µm / >6µm / >14µm per milliliter.
Healthy systems maintain ISO 4406 code of 17/15/12 or better (fewer than 640 particles >4µm per milliliter). Trending particle counts reveals:
- Stable counts = normal operation
- Gradual increase = normal wear progressing acceptably
- Sudden spike = acute component failure, investigate immediately
For Interpump units like Interpump PUMP E3C1021 DXV.DXNO.C/J, particle count typically increases slowly during first 500 operating hours (running-in period), then stabilizes. Sudden increases signal bearing damage, piston/cylinder scoring, or valve spool stiction.
Elemental Analysis (ICP Spectroscopy):
Elemental composition reveals internal component wear sources:
- Iron (Fe) elevation = piston/cylinder or bearing wear
- Copper (Cu) increase = bearing cage or bronze component erosion
- Aluminum (Al) trending = valve spool or housing corrosion
- Lead (Pb) increase = bearing babbit material degradation (critical condition)
- Nickel (Ni) and Chromium (Cr) = stainless steel valve component erosion
Establish baseline elemental levels during commissioning, then trend monthly. A doubling of any element within 12 months indicates accelerated wear requiring investigation.
Acid Number (TAN) Progression:
Total Acid Number measures fluid oxidation—higher TAN indicates increased corrosive compounds. TAN progression indicates:
- Acceptable: TAN increase <0.5 per year under normal conditions
- Monitor: TAN increase 0.5-1.0 per year = consider fluid change within 6 months
- Critical: TAN increase >1.0 per year = fluid change urgently required
Elevated TAN accelerates corrosion of internal components, particularly valve spools and pump housings.
Section 4: Implementation Framework for Maintenance Teams
Building a Predictive Maintenance Program Structure
Transitioning from reactive to predictive maintenance requires organizational structure and disciplined implementation:
Phase 1: Baseline Data Collection (Weeks 1-8)
- Audit all installed Pumps & Compressors and assign priority levels (critical, important, standard)
- Establish baseline measurements for each unit
- Implement centralized data recording system (spreadsheet, CMMS software, or cloud platform)
- Train technicians on measurement protocols and equipment operation
- Execute weekly manual observations (pressure, temperature, acoustic)
- Schedule monthly vibration analysis using portable equipment
- Begin quarterly fluid sampling at certified laboratories
- Document all readings in centralized database with date, time, and operator identification
- Analyze 8-16 weeks of collected data
- Calculate trend lines for key parameters (pressure rise, temperature, vibration amplitude)
- Identify units showing degradation trends
- Prioritize maintenance actions based on failure risk assessment
- Schedule seal replacements or component rebuilds 4-6 weeks before predicted failure
- Order replacement units for critical equipment with advanced degradation
- Document intervention results and adjust prediction models
Risk Assessment Matrix for Maintenance Prioritization
When budget constraints limit immediate action on all degrading equipment, risk matrices guide prioritization:
Risk Calculation: Equipment Priority Score
For each Pump or Compressor, calculate:
Priority Score = (Impact of Failure × Probability of Failure) × Cost Multiplier
Impact of Failure Scale:
- Critical (5 points) = production stops entirely, safety hazard, or revenue loss >$100,000 per day
- High (4 points) = significant production reduction, minor safety concern, revenue impact $10,000-$100,000 per day
- Medium (3 points) = partial production impact, no safety concern, revenue impact $1,000-$10,000 per day
- Low (2 points) = minimal operational impact, revenue <$1,000 per day
- High (5 points) = multiple failure indicators, age >10 years, no maintenance records
- Moderate-High (4 points) = 2-3 concerning diagnostic indicators
- Moderate (3 points) = 1 concerning indicator, trending toward critical range
- Low (2 points) = stable baseline, no trend deviation, well-maintained history
- Very Low (1 point) = new equipment, excellent baseline stability
- Emergency replacement cost (if failed) / Preventive maintenance cost (if done proactively)
Example: Critical pump showing bearing wear (probability 4) where emergency replacement costs $50,000 but proactive seal/bearing service costs $8,000 = 6.25x multiplier.
Equipment exceeding priority score of 60 becomes immediate action items; scores 40-60 receive scheduling within 30 days; scores below 40 enter standard rotation schedule.
Documentation and Trend Management
Maintenance data only creates value when systematically analyzed. Implement:
Equipment History Files:
Maintain permanent records for each unit containing:
- Original baseline measurements
- Monthly trend data (graphed, not just tabulated)
- Oil analysis results with trend notes
- Maintenance actions performed with dates and technician names
- Parts replaced with part numbers and costs
- Downtime events with root cause analysis
Schedule monthly review meetings examining:
- Equipment showing unusual trends
- Oil analysis results requiring investigation
- Comparison of predicted versus actual failure timing
- Effectiveness of maintenance interventions
- Budget allocation adjustments based on failure patterns
As your facility accumulates historical data, refine failure prediction models:
- Track actual failure dates against predicted values
- Calculate prediction accuracy rates
- Adjust monitoring thresholds based on your facility's specific equipment behavior
- Share learnings across similar equipment and different facility locations
Conclusion: Strategic Value of Diagnostic Excellence
Pumps & Compressors represent substantial capital investments and critical operational assets. Organizations that shift from reactive replacement strategies to diagnostic-driven predictive maintenance realize measurable benefits:
- 30-40% reduction in emergency equipment failures
- 50-70% extension of equipment service life through early intervention
- 25-35% reduction in total cost of ownership
- Improved safety records through detection of failure precursors
- Enhanced production scheduling through elimination of unexpected downtime
As an distributor with 35+ years serving global industrial operations, 3G Electric recognizes that successful equipment management depends not only on having quality replacement components—like Interpump PUMP E3B2515I R, Interpump PUMP E3B2515 L, and Interpump PUMP E3C1021 DXV.DXNO.C/J—but on implementing the diagnostic practices and monitoring discipline that prevent premature failures.
The diagnostic protocols outlined in this guide transform maintenance from a cost center focused on reactive replacement into a strategic capability that protects equipment investments and ensures production continuity. Start with baseline establishment on your most critical equipment, implement consistent monitoring discipline, and build analytical capability over successive quarters. The data patterns you uncover will guide intelligent maintenance decisions for years to come.