Understanding Performance Metrics Beyond Nameplate Specifications
When evaluating Pumps & Compressors for procurement, most engineers focus on flow rate (GPM/LPM) and pressure (PSI/bar) ratings. However, nameplate specifications represent ideal laboratory conditions that rarely match real-world industrial environments. As an global industrial equipment distributor with 35+ years of experience, 3G Electric has observed that procurement decisions based solely on basic specs result in 15-20% higher total cost of ownership due to inefficiency losses, unexpected downtime, and premature replacement cycles.
Performance metrics evaluation requires understanding three critical dimensions: volumetric efficiency (actual flow delivered versus theoretical displacement), isentropic efficiency (useful work output versus input energy), and mechanical losses (friction, slippage, and thermal degradation). These metrics directly impact operational cost per unit of work performed. For procurement engineers managing global supply chains, establishing standardized performance evaluation protocols ensures consistency across facilities in different regions while building institutional knowledge that informs future specifications.
The challenge is that manufacturers report efficiency figures under controlled test conditions using ISO 1219-1 or similar standards, but your facility operates with different fluid temperatures, contamination levels, component wear rates, and duty cycles. A pump rated at 88% efficiency in laboratory conditions might deliver only 72-75% efficiency in harsh industrial environments. Understanding this variance is essential for accurate total cost of ownership (TCO) modeling and supplier negotiations.
Establishing Baseline Performance Testing Protocols
Before deploying new Pumps & Compressors equipment, procurement engineers should implement baseline performance testing that captures actual operating conditions. This involves four measurable activities: flow measurement validation, pressure drop analysis, temperature monitoring, and power consumption tracking.
Flow Measurement and Validation: Install calibrated flow meters (ultrasonic or turbine types depending on fluid properties) at pump discharge and system return points. Record flow rates under minimum, average, and maximum system demand scenarios. Compare measured flow against nameplate capacity at observed operating pressures. Discrepancies exceeding 5% indicate potential cavitation, internal leakage, or component wear that impacts long-term reliability.
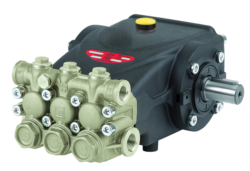
For example, the Interpump PUMP E3B2515I R is rated for specific displacement per revolution. Your baseline test should verify actual displacement delivery across different inlet pressures and fluid viscosities. This data becomes your performance benchmark for detecting degradation over time.
Pressure Drop and System Resistance Profiling: Map pressure losses across your system architecture at different flow rates. Document inlet pressure (suction side), discharge pressure, and pressure differentials across filters, heat exchangers, and control valves. High pressure drop indicates excessive system resistance that forces the pump to work harder, reducing overall efficiency. Typical industrial systems should maintain discharge pressures within 5% of design setpoint across 80% of the operating range.
When evaluating units like the Interpump PUMP E3B2515 L, pressure profiling reveals whether your system design matches the pump's optimal operating envelope. Some applications benefit from gear-driven designs like the Interpump PUMP E3B1515 DX*VALV.DX + GEARBOX RS500H, which provides consistent torque delivery across variable load conditions.
Temperature Monitoring Strategy: Thermal performance indicates mechanical losses and fluid degradation rate. Install temperature sensors at pump inlet, discharge, and system reservoir. Track temperature rise during duty cycles. A well-designed system should exhibit temperature rise of 3-5°C per operating hour under normal load. Temperature rise exceeding 8°C indicates excessive friction losses or inadequate cooling capacity. This directly impacts fluid life (ISO VG 46 hydraulic oil degrades 50% faster for each 10°C above optimal operating temperature of 55°C).
Power Consumption Analysis: Measure actual electrical power draw (kW) during operation using calibrated power meters. Calculate hydraulic power output (Flow [LPM] × Pressure [bar] ÷ 600 = kW output). The difference between input and output power represents total losses. Track this ratio over time; increasing power consumption at constant flow/pressure indicates internal wear.
Comparative Evaluation Framework for Multi-Unit Procurement Decisions
When your facility requires multiple Pumps & Compressors units across different production lines or geographic locations, standardized comparison matrices prevent specification drift and leverage volume purchasing power. 3G Electric recommends establishing evaluation criteria that extend beyond initial purchase price to encompass operational, maintenance, and replacement cost variables.
Create a Weighted Scoring Matrix: Assign relative importance (percentage weighting) to these categories: acquisition cost (20%), volumetric efficiency rating (18%), thermal stability (15%), component availability (12%), predictive maintenance capability (12%), supplier support response time (10%), spare parts compatibility (8%), and regulatory/certification compliance (5%). Different facility types may adjust weightings—a facility in challenging tropical climates might increase thermal stability weighting to 20% while reducing component availability to 8%.
For units like the Interpump PUMP E3C1021 DXV.DXNO.C/J and Interpump PUMP E3C1515 L, procurement evaluation should verify that component architectures align with your facility's technical service capability. Units with modular valve sections and accessible displacement settings allow field technicians to adapt equipment without factory remanufacturing, improving uptime and reducing logistics cost.
Develop Duty Cycle Simulation Models: Create representative operating scenarios that match your actual applications. Many procurement errors occur because engineers evaluate Pumps & Compressors against "typical" industrial duty cycles when their specific application involves frequent pressure spikes, continuous operation at partial displacement, or temperature extremes. Simulation models should include load profiles, thermal load modeling, and efficiency curves across the anticipated operating envelope.
For example, a packaging machinery application might require 15-minute high-pressure cycles followed by 5-minute idle periods, repeated 8-10 times hourly. A pump selected for "average duty" at nominal pressure will experience excessive wear during high-pressure transients and thermally stress the fluid during idle periods. Proper evaluation models these cycles to identify equipment rated specifically for cyclic service rather than continuous operation.
Establish Efficiency Degradation Tracking: Request historical efficiency degradation data from the manufacturer or similar facilities. Most industrial Pumps & Compressors exhibit 1-2% annual efficiency loss under normal conditions, but certain applications experience 3-4% degradation. Knowing degradation rate allows accurate TCO modeling. A pump that costs 8% more but degrades at half the rate often delivers superior lifetime value.
Operational Verification and Performance Acceptance Criteria
Once equipment is installed, implement formal performance acceptance testing before transferring asset ownership from supplier to facility. This protects against warranty gaps and establishes irrefutable baseline metrics for future troubleshooting.
Acceptance Testing Protocol: Execute a minimum 50-hour operational test at rated capacity under ambient conditions matching seasonal extremes your facility experiences. Document hourly measurements of flow (±3% tolerance), pressure (±5% tolerance), temperature rise (within design specification), and power consumption (within 5% of rated nameplate values). Reject equipment failing to meet acceptance criteria—attempting to debug non-conforming new equipment wastes technical resources and introduces hidden efficiency penalties.
Performance Warranty Clauses: Negotiate specific performance guarantees rather than generic hardware warranties. Specify that equipment must maintain minimum volumetric efficiency of X% (typically 3 points below original nameplate) over the warranty period. Request manufacturer liability for efficiency shortfalls exceeding contractual minimums, with remedies including repair, replacement, or credit toward future purchases.
Data-Logging Infrastructure: Implement continuous monitoring on critical equipment using IoT-enabled pressure/temperature sensors and power monitoring relays. Modern supervisory systems (SCADA) or even basic cloud-connected devices provide early warning of performance degradation. Trending data from months 1-12 reveals whether equipment is performing as procured or silently degrading due to manufacturing defects.
After 35+ years serving industrial operations globally, 3G Electric emphasizes that procurement engineers who invest in rigorous performance evaluation reduce equipment-related downtime by 22-30% compared to facilities using basic specification-matching approaches. This systematic methodology transforms Pumps & Compressors procurement from transactional purchasing into strategic operational asset management.
Practical Implementation Across Global Facilities
For multinational operations, performance metric evaluation standardization enables meaningful benchmarking across regions and identifies optimization opportunities. If your Singapore facility achieves 84% overall efficiency on a specific pump model while your Melbourne facility operates the identical equipment at 76% efficiency, that 8-point gap represents quantifiable operational variance worth investigating (often revealing maintenance discipline differences, coolant quality variation, or system design deviations).
Implement a centralized performance database documenting baseline metrics, acceptance test results, and historical efficiency trends for every major Pumps & Compressors unit across your global operations. This institutional knowledge supports faster troubleshooting, informs replacement procurement cycles, and identifies which suppliers consistently deliver rated performance versus those producing equipment that underperforms specifications.