Introduction: Controls & Safety Through Predictive Testing
Industrial burner systems across Southeast Asia operate in challenging environments—high humidity, corrosive salt air in coastal regions, and temperature fluctuations that stress electronic controls. Rather than waiting for Controls & Safety components to fail, predictive testing identifies degradation before shutdown occurs.
With 35+ years of experience distributing industrial equipment throughout Southeast Asia, 3G Electric has observed that facilities implementing predictive condition monitoring reduce unplanned downtime by 40–60% and extend component life by 18–24 months. This guide provides practical, field-tested procedures for monitoring burner control relays, flame detection systems, solenoid valves, and related safety devices.
Section 1: Establishing a Baseline Testing Protocol for Control Relays
Understanding Your Control System Components
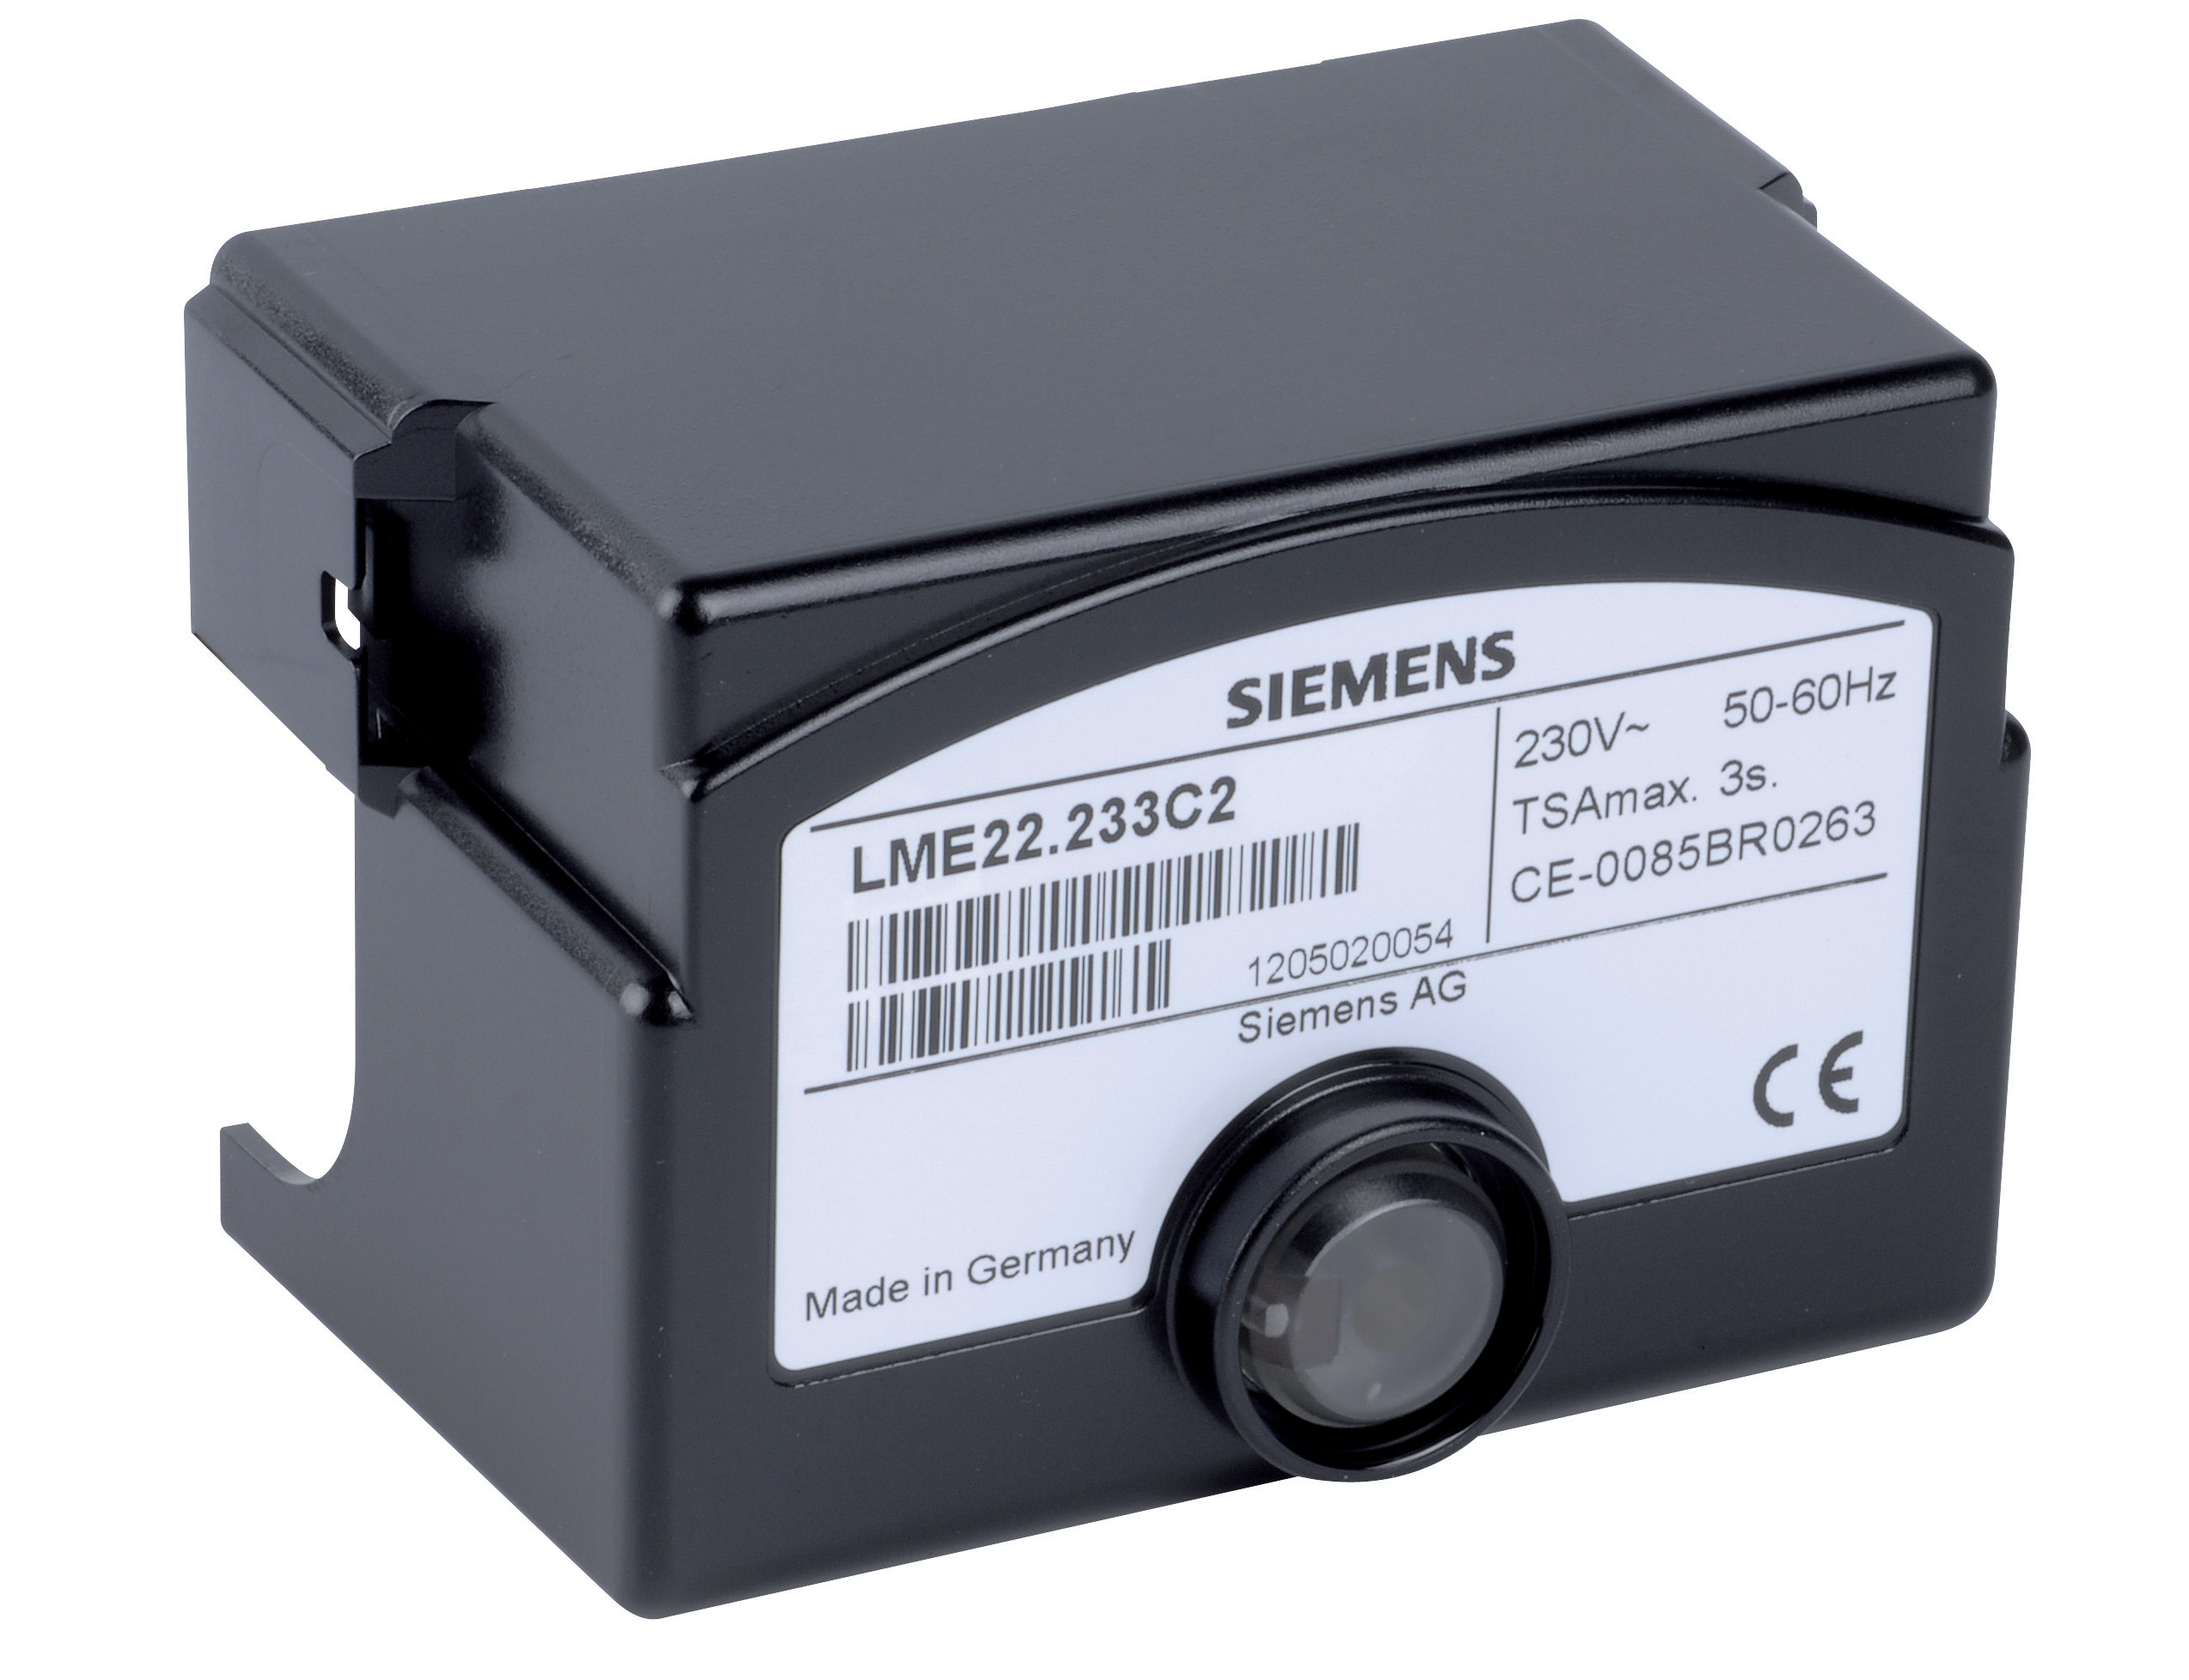
Burner control relays like the Satronic Relay DMG 970-N MOD.01 and Siemens LME 22 233C2 relay are the critical decision-making devices in your safety chain. These relays receive signals from flame detectors and pressure switches, then command solenoid valves to open or close gas supply. Over time, contact erosion, coil resistance changes, and switching delays degrade relay performance.
Establishing baseline measurements means testing each relay under controlled conditions when new or recently installed, then comparing field measurements against this baseline.
Practical Baseline Testing Procedure
Step 1: Measure Coil Resistance
- Use a digital multimeter (DVM) set to ohms (Ω)
- Disconnect power to the relay
- Probe both coil terminals
- Record the reading (typical range: 200–3000 Ω depending on model)
- Document voltage rating and model number in your maintenance log
- With power disconnected, set DVM to continuity or low-ohm range
- Probe the normally-open (NO) contacts—should read high resistance (typically >10 MΩ) when de-energized
- Probe the normally-closed (NC) contacts—should read <1 Ω when de-energized
- Repeat measurements with relay energized at rated voltage
- Record all values; variations >20% from baseline indicate contact wear
- Use an adjustable AC or DC power supply (depending on relay type)
- Slowly increase voltage from zero until relay clicks (pickup voltage)
- Slowly decrease voltage until relay releases (dropout voltage)
- Record both; dropout should be 70–90% of pickup voltage
- If dropout exceeds 95% of pickup, contact contamination is likely
- For critical safety applications, use an oscilloscope or digital relay test set
- Measure delay from coil energization to contact closure (typically 10–50 ms)
- Compare to manufacturer specifications; degradation >15% suggests spring wear
Storage and Analysis
Maintain a simple spreadsheet or CMMS database recording:
- Component serial number and SKU
- Installation date
- Baseline measurements (date, technician name, readings)
- Quarterly/biannual test results with dates
- Environmental notes (humidity, temperature, vibration level)
- Trend analysis: plot resistance and timing measurements over 12–24 months
When any parameter drifts 25–30% from baseline, schedule replacement within 30 days to avoid safety margin erosion.
Section 2: Condition Monitoring for Flame Detection Systems
Why Flame Detectors Require Predictive Testing
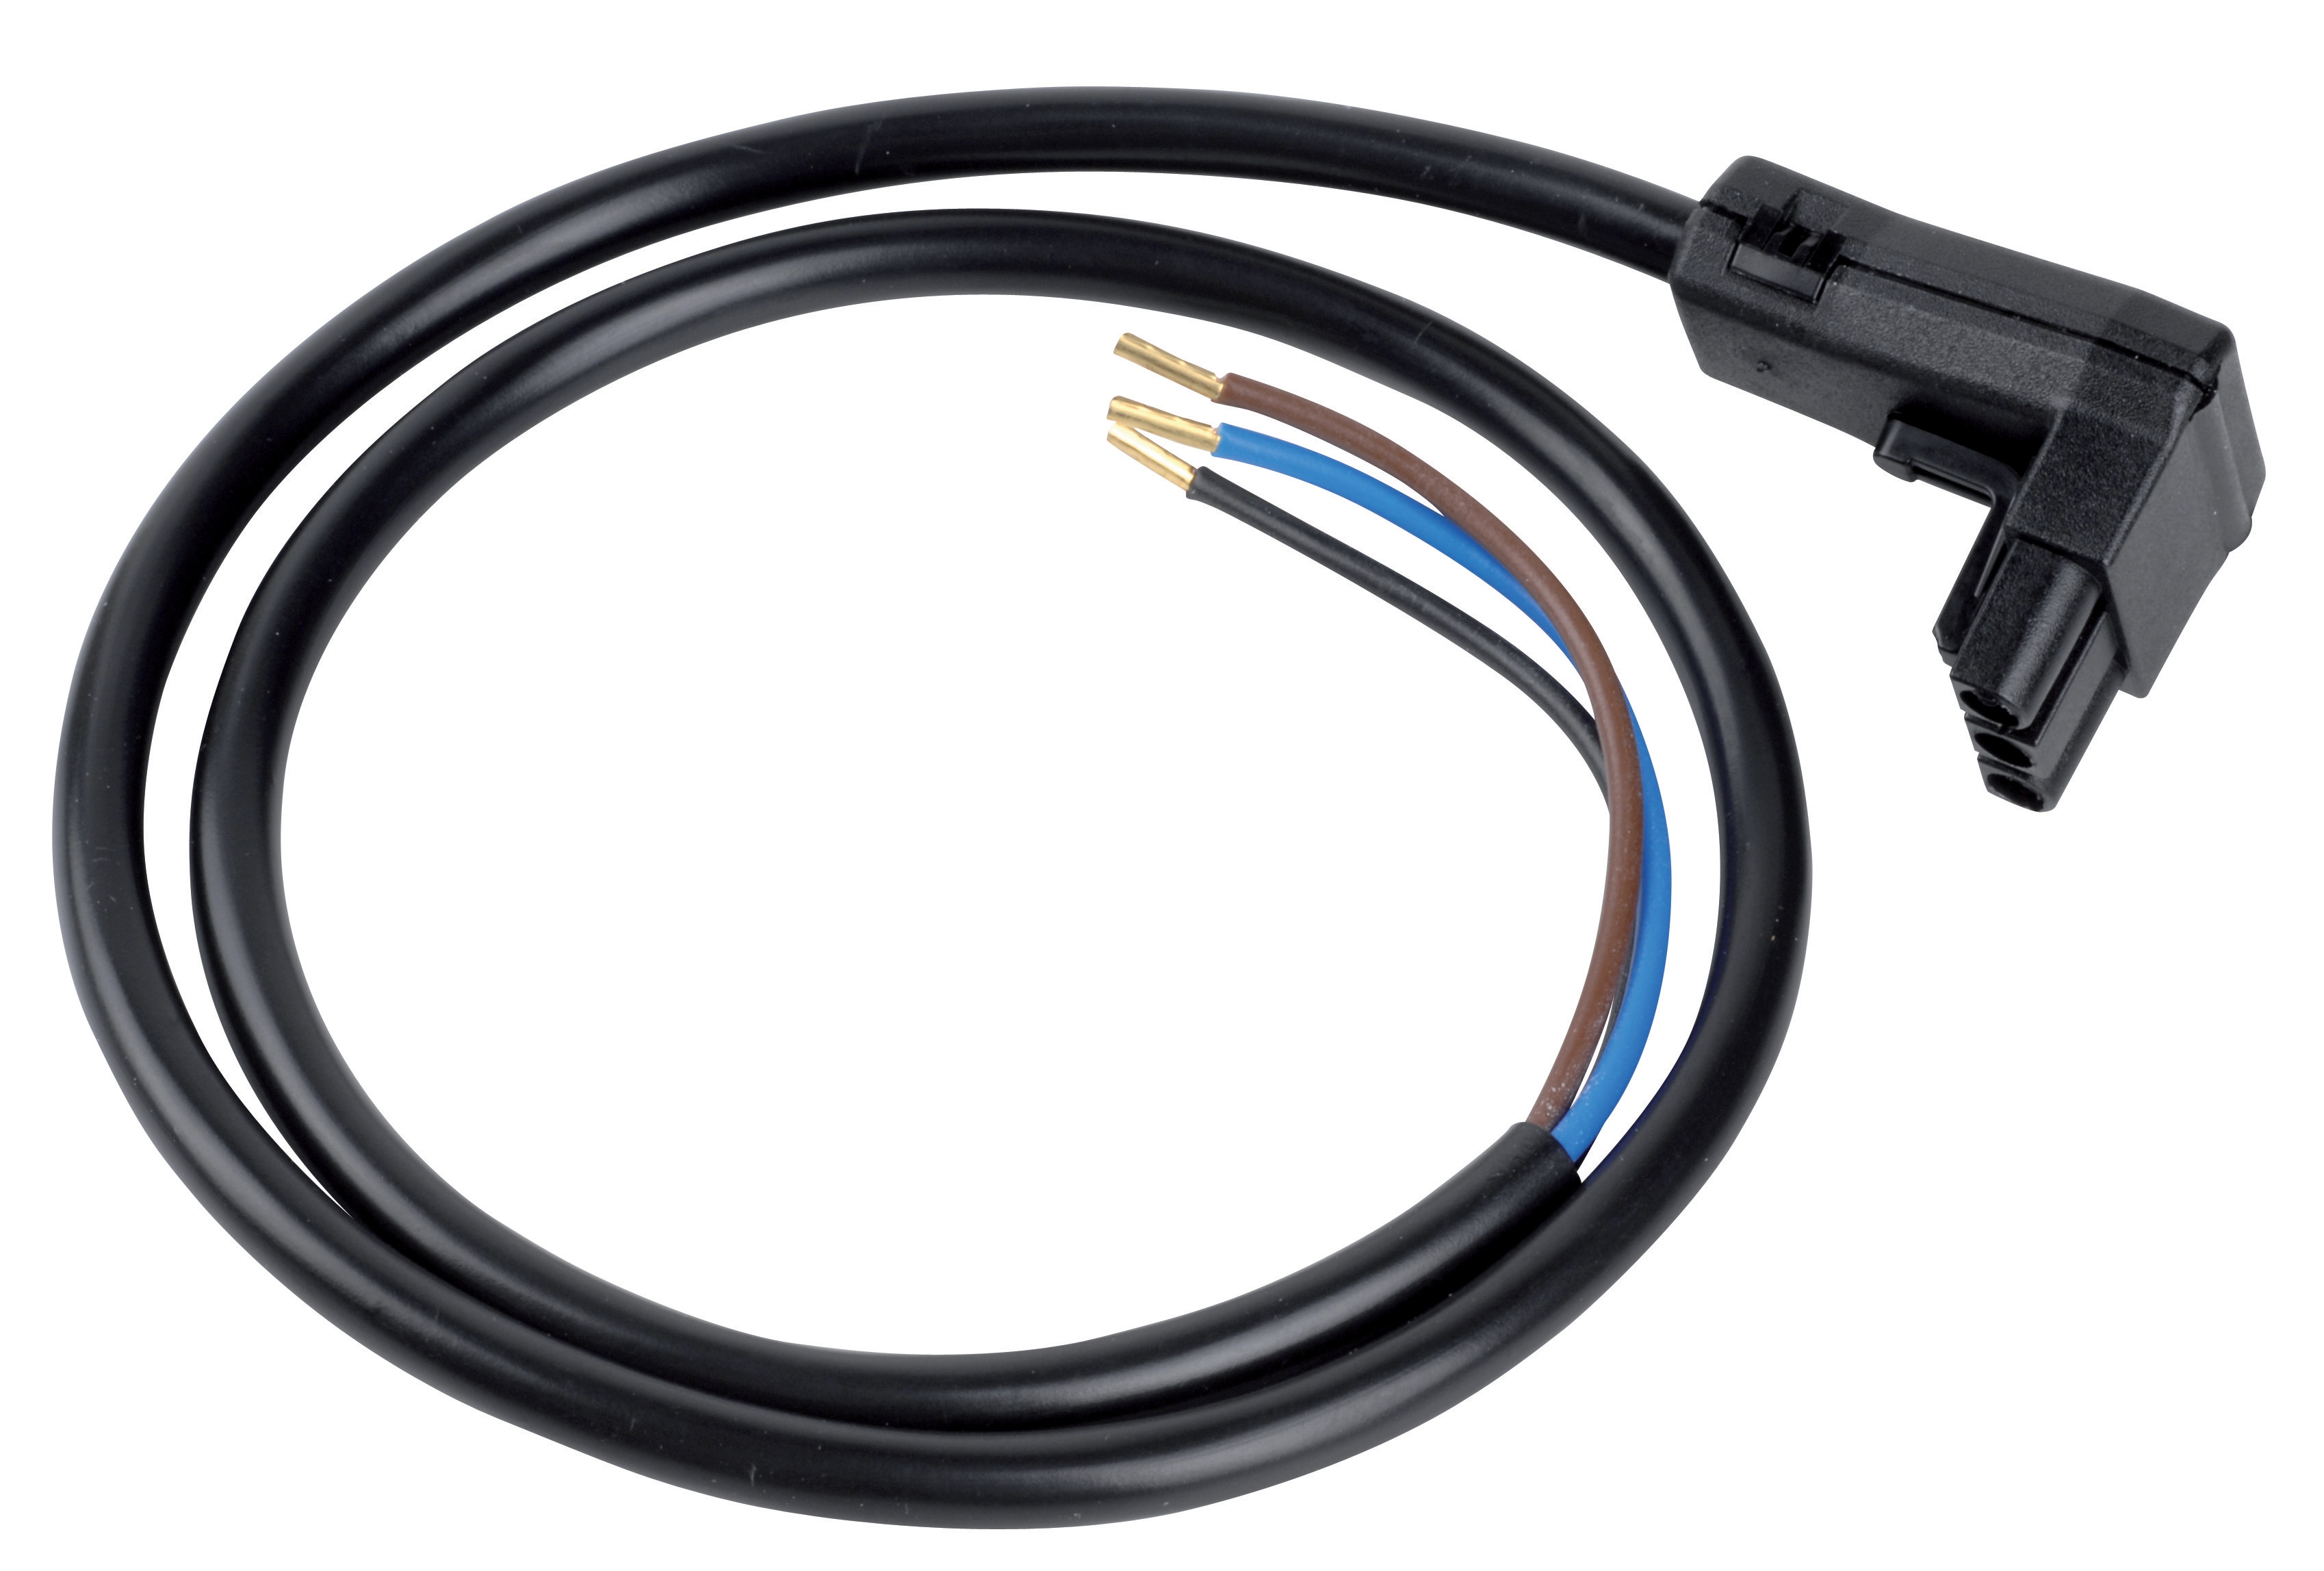
Flame detectors—whether ultraviolet (UV), infrared (IR), or ionization type—are the "eyes" of your burner control system. The Satronic Cable for IRD10 flame detector and associated detector optics degrade gradually from dust accumulation, optical surface oxidation, and sensor aging. Unlike a relay that typically fails suddenly, flame detectors fail gradually, reducing signal strength until the system can no longer distinguish flame from noise.
Monthly Visual and Optical Inspection
Procedure:
1. Visual inspection of detector housing: Look for dust, moisture condensation, or insect debris on the detector window. Southeast Asia's humid climate accelerates these issues.
2. Optical lens cleaning: Use lens cleaning tissue and isopropyl alcohol (99%). Wipe gently in circular motions from center outward. Do not use compressed air—high-pressure air can force moisture into the optical chamber.
3. Check cable connections: Ensure the detector cable connectors are seated fully and show no corrosion or green oxidation on pins. In coastal regions, apply a thin layer of dielectric grease to connector pins to prevent salt-air corrosion.
4. Visual signal strength check: Many modern flame detectors have LED indicators. A bright, steady LED indicates good signal; a dim or flickering LED suggests optical degradation.
Quarterly Signal Strength Testing
Test Setup:
- Obtain a handheld flame detector analyzer or use your burner control system's built-in diagnostics (if available)
- Record the detector's signal strength reading in the current operating state (typically expressed as % of full scale or a numeric code 0–9)
- Baseline signal should be 70–100% of maximum
1. Operate the burner in steady-state flame condition
2. Measure signal strength at the detector output (consult your system manual for test point location)
3. Record the value and date
4. Plot monthly readings; a steady downward trend of 5–10% per quarter indicates cleaning is needed
5. If trend shows >20% decline in three months, schedule detector replacement
Simulated Flame-Out Test:
- With the burner running safely, momentarily interrupt the flame using the ignition source cutoff (not the main fuel valve)
- Observe how quickly the control system detects loss of flame and initiates shutdown
- If shutdown takes >2 seconds or does not occur, the flame detector signal is likely weak; clean optics and retest
- If problem persists, replace the detector
Environmental Considerations for Southeast Asia
High humidity and salt spray accelerate optical degradation. Implement:
- Monthly cleaning in coastal facilities rather than quarterly
- Silica gel packets inside weatherproof detector housings (replace every 3 months)
- Protective covers on detectors when equipment is idle or undergoing maintenance, to reduce dust accumulation
Section 3: Solenoid Valve Response Testing and Performance Trending
Why Solenoid Valves Demand Predictive Attention
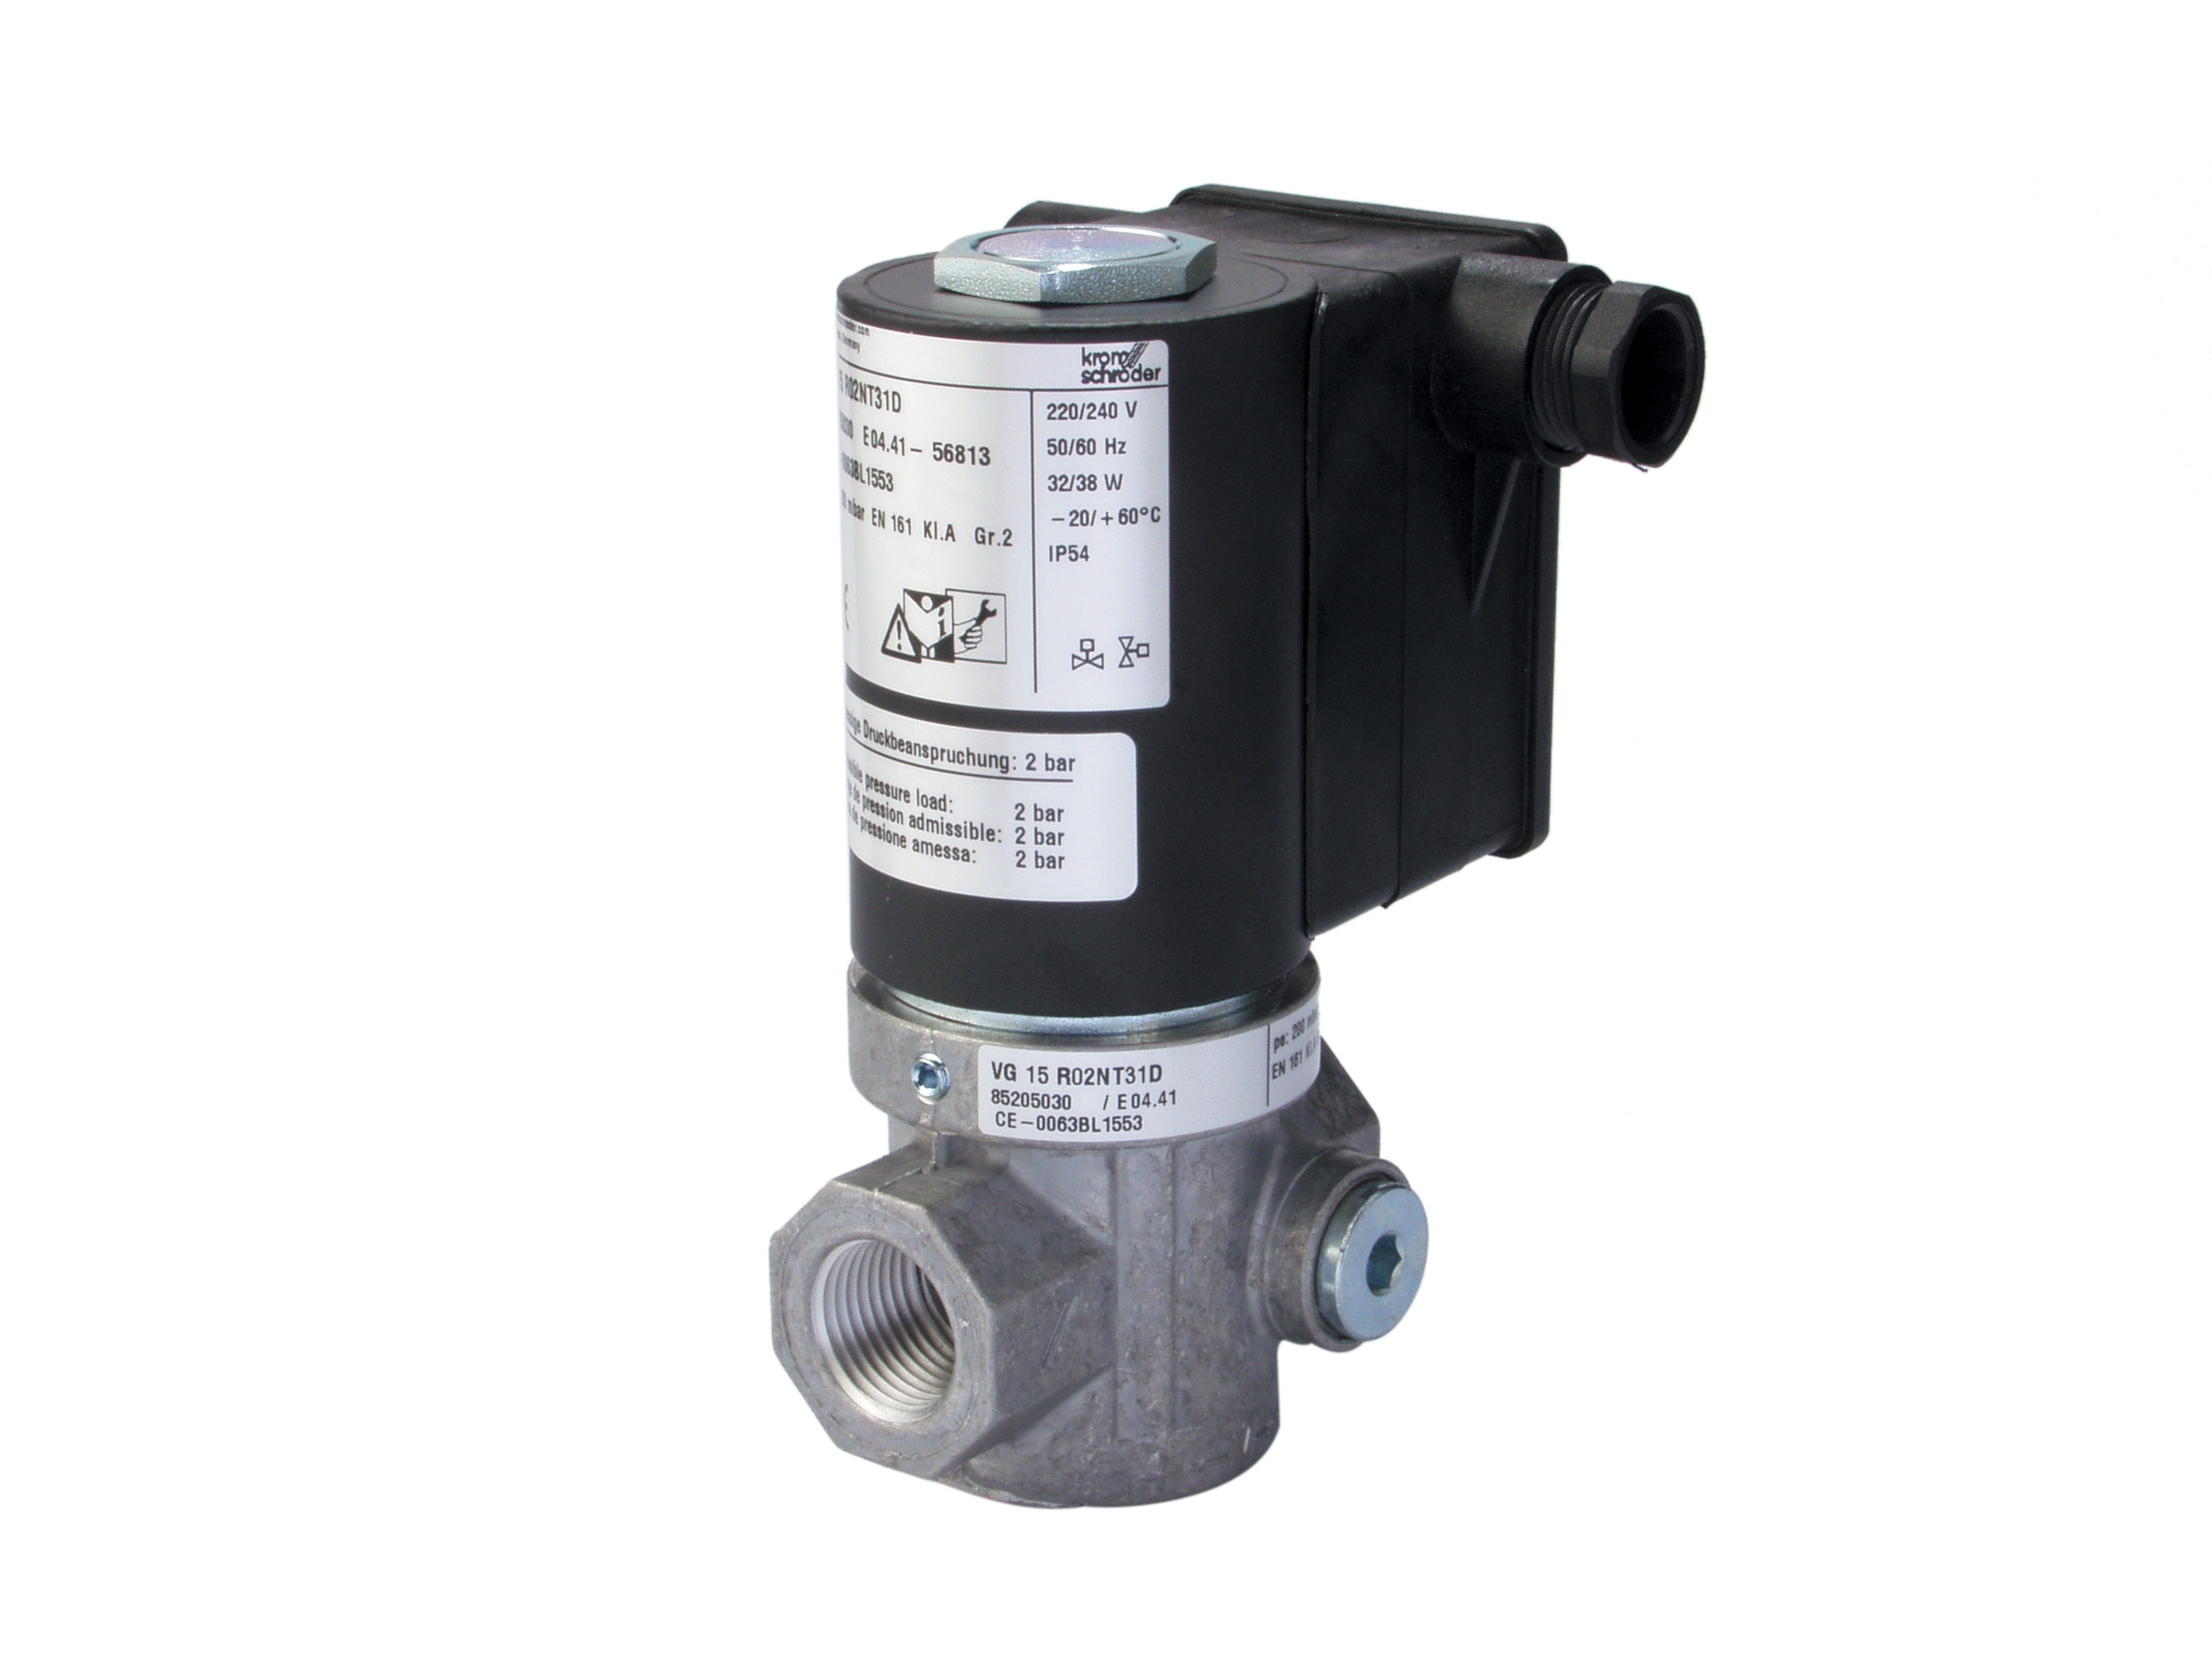
Fast-acting gas solenoid valves like the Kromschroder VAS 115R/NQ control fuel delivery with precision timing. The valve's coil generates a magnetic field to open a pilot stage, which in turn opens the main valve seat. Over 1–2 years of operation, magnetic coil degradation, internal spring weakening, and pilot orifice blockage slow the valve's response time. A 50 ms increase in opening time might seem minor, but it extends flame establishment time, reducing burner efficiency and increasing emissions.
Testing Solenoid Response Time
Equipment Needed:
- 24V DC or AC power supply (depending on valve type)
- Oscilloscope or digital relay test set with valve contact output channel
- Pressure gauge (0–0.5 bar range)
- Stopwatch (for manual verification)
1. Isolate the valve from the burner control circuit (do not test on live combustion equipment without proper isolation and lockout procedures)
2. Connect power supply with proper polarity (for DC valves)
3. Apply rated voltage (consult Kromschroder VAS 115R/NQ datasheet: typically 110–230V AC)
4. Listen for the solenoid click: You should hear an immediate, crisp "click" sound as the plunger seats
5. Measure pilot outlet pressure: Connect a pressure gauge to the pilot stage outlet (0–0.5 bar range)
6. Energize the coil and record the time from energization until pilot pressure rises to 80% of supply pressure
- Baseline: typically 20–40 ms
- Acceptable: <60 ms
- Replace if: >100 ms
7. Test de-energization response: Remove power and measure time for pilot pressure to decay to 20% of peak
- Should occur within 50–80 ms
- Sluggish decay (>150 ms) indicates internal leakage or blocked exhaust ports
Field Testing on Operating Equipment
Burner-mounted response test (safe method when burner is offline):
1. Shut down the burner and allow it to cool
2. Close manual isolation valve downstream of the solenoid
3. Reconnect power to the solenoid valve
4. Energize for 1 second, then de-energize
5. Repeat 3–5 times and listen for:
- Loud, prompt "click" = normal
- Weak "click" or delayed response = coil degradation
- No response = solenoid failure (replace immediately)
Quarterly Performance Trend Log
Maintain a simple record:
| Date | Valve SKU | Response Time (ms) | Baseline (ms) | % Change | Status | Action |
|------|-----------|-------------------|---------------|----------|--------|--------|
| Jan 2024 | KRO06003 | 35 | 35 | 0% | Normal | Monitor |
| Apr 2024 | KRO06003 | 42 | 35 | +20% | Acceptable | Clean/inspect |
| Jul 2024 | KRO06003 | 48 | 35 | +37% | Borderline | Schedule replacement |
Section 4: Building a Predictive Maintenance Program for Your Facility
Monthly Checklist for Controls & Safety
Week 1:
- Visual inspection of all relay housings for moisture, dust, or physical damage
- Check all electrical connectors for corrosion (especially in coastal areas)
- Verify LED status lights on burner control boxes (e.g., Sit Control box Sit 0579311)
- Clean flame detector optics and check signal strength
- Measure coil resistance on 2–3 critical control relays using rotating schedule
- Inspect solenoid valve coil connectors and mounting brackets
- Test one pressure switch (if system has them) using adjustable air supply and gauge
- Verify grounding continuity on all safety circuit wiring (use DVM continuity function)
- Document any changes from baseline in your CMMS or spreadsheet
- Review trends from the past month; identify any parameters trending toward replacement thresholds
- Plan component procurement if any items are approaching 90% of maximum allowable drift
Quarterly Full System Test
Every three months, perform a complete controls sequence test:
1. Energize the control panel and verify all indicator lights come on
2. Simulate flame failure by interrupting the flame source and confirm immediate shutdown
3. Test the manual reset button (if equipped) and verify it re-enables the system after lockout
4. Measure solenoid valve response time on one valve per quarter (rotating through all solenoids over the year)
5. Check all safety interlocks: door switches, temperature limits, pressure limits—verify each one independently triggers safe shutdown
6. Record all results in your maintenance log with technician name, date, and any corrective actions taken
Documentation and Spares Planning
Maintain:
- Component inventory log: List all control relays, solenoids, flame detectors, and cables with SKU, location, installation date, and baseline test results
- Spare parts list: Based on your predictive testing trends, maintain in stock:
- 1× spare solenoid valve
- 1× spare flame detector cable
- Connector repair kits and terminal pins (Southeast Asia humidity and salt spray create frequent connector issues)
3G Electric's 35-year track record across Southeast Asia shows that facilities maintaining predictive test logs and trending data reduce emergency repairs by 60%, lower total cost of ownership by 25–30%, and achieve safety audit compliance more readily.
Integration with Regulatory Compliance
Many Southeast Asian industrial sites must comply with:
- Singapore (PEA 2013): Periodic testing of safety devices is mandatory
- Malaysia (DOSH): Electrical safety documentation required for inspection
- Thailand (DSI): Pressure equipment and control systems subject to technical file requirements
Your predictive testing log serves as evidence of due diligence. When auditors request proof that Controls & Safety components are functioning within specification, trending data demonstrates systematic oversight and proactive maintenance culture.
Conclusion
Predictive testing transforms burner control systems from "hope it doesn't fail" mode to "we know its condition and lifespan." By implementing monthly visual checks, quarterly signal and response time measurements, and trending results over 12–24 months, your facility gains:
- Earlier warning of component degradation (giving 30–90 days to plan replacements)
- Extended component life through targeted cleaning and environmental controls
- Reduced unplanned downtime and associated production losses
- Improved safety margins because you're replacing components before they reach minimum operational thresholds
- Regulatory documentation demonstrating competent control of industrial safety systems
For Southeast Asian operations, where climate conditions accelerate degradation, predictive maintenance is not optional—it's the practical path to reliable, compliant industrial burner operations.