Understanding Pumps & Compressors Failure Mechanisms
With over 35 years of experience as a global industrial equipment distributor, 3G Electric has observed that most pump and compressor failures follow predictable degradation patterns. Unlike catastrophic failures that occur without warning, the majority of industrial pump failures develop gradually through identifiable stages: incipient wear, accelerated deterioration, and functional degradation.
Plant managers often operate equipment until complete failure occurs, resulting in emergency procurement, installation delays, and production losses. A systematic failure analysis approach transforms this reactive posture into predictive maintenance. The key is recognizing that Pumps & Compressors failures are not random events—they are the culmination of measurable physical changes that occur over weeks or months.
The most common failure mechanisms in industrial pumps include bearing wear, seal degradation, impeller erosion, and internal cavitation. Each produces distinct symptoms that skilled operators can detect through vibration analysis, temperature monitoring, and flow rate measurement. For example, bearing wear typically manifests as increasing vibration amplitude in the 2–5 kHz frequency range, while seal degradation appears first as minor pressure leakage and elevated fluid temperature.
Diagnostic Protocols: Establishing Baseline and Trending Data
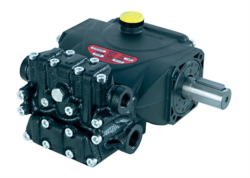
Effective diagnostics begins with establishing baseline performance metrics when equipment is new or newly installed. The Pratissoli KF30 high-performance industrial pump, for instance, operates at precisely 106 L/min flow rate and 200 bar pressure under nominal conditions. Recording these parameters—along with vibration velocity, bearing temperature, and discharge line pressure—creates a diagnostic reference point.
Over the equipment's operational life, plant managers should collect performance data at fixed intervals: weekly during commissioning phases, monthly during normal operation, and daily once degradation symptoms appear. Modern Industrial IoT (IIoT) systems automate this data collection, but manual measurement protocols using portable instruments remain effective and cost-justified for critical equipment.
Key diagnostic parameters to monitor:
- Vibration amplitude and frequency content – Measured in mm/s RMS; bearing wear typically elevates overall vibration 30–50% above baseline before audible noise appears
- Discharge fluid temperature – Rising 8–15°C above normal indicates seal leakage or internal recirculation; sustained elevation above 70°C accelerates fluid degradation
- Flow rate variance – Deviation >5% from rated capacity signals impeller wear, slippage, or cavitation
- Pressure decay – Monitoring no-load pressure rise time; slow buildup indicates pump wear or valve leakage
- Acoustic emission – High-frequency signals (>20 kHz) correlate with cavitation; metallic grinding sounds indicate bearing distress
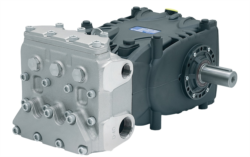
The Pratissoli MW40 series, rated at 211 L/min and 210 bar, demonstrates how larger displacement pumps require more rigorous trending because their mass and inertia mask early degradation. A MW40 showing 5% flow loss may appear functionally adequate but indicates internal clearance growth that will accelerate within 200–400 operating hours.
Compressor diagnostics follow similar principles. Suction pressure, discharge temperature, and motor current draw form the core monitoring triad. Compressor failures most commonly originate from liquid carryover (flooding), thermal valve malfunction, or reed valve degradation. Unlike pump failures, compressor failures often escalate rapidly from diagnosis to failure because elevated discharge temperatures quickly damage motor insulation.
Root Cause Analysis Framework
When diagnostic data indicates anomalies, plant managers must distinguish between incipient failure (progressing slowly) and acute failure (imminent). This distinction determines whether replacement can be planned during scheduled maintenance windows or requires immediate intervention.
Incipient failure indicators:
- Gradual parameter drift over 4+ weeks
- Single-parameter anomalies (e.g., elevated temperature without vibration change)
- No acoustic or visual evidence of distress
- System continues meeting production targets with possible efficiency loss
- Rapid parameter changes over hours or days
- Multiple simultaneous anomalies (vibration + temperature + noise)
- Visible evidence: fluid discoloration, metal particles in drain pan, external leakage
- Audible grinding, knocking, or cavitation sounds
- System output falls below process requirements
Root cause identification prevents recurring failures after replacement. For example, if a compact Interpump gear pump rated at 8 L/min and 180 bar fails prematurely due to cavitation, the root cause may be inadequate fluid supply line diameter, excessive fluid viscosity at operating temperature, or suction strainer blockage. Replacement without addressing the underlying cause results in repeat failure within 200–500 hours.
The Interpump ET1C1612 SX*D20 with PTFE construction, delivering 12 L/min at 160 bar, is frequently specified when standard materials fail due to aggressive fluid compatibility issues. However, the root cause analysis must confirm that fluid chemistry or external environmental contamination caused the original failure; otherwise, premium material specifications alone provide no longevity benefit.
Plant managers should establish a failure log documenting:
- Equipment identity and service history
- Failure symptoms and timeline
- Environmental conditions (ambient temperature, humidity, fluid contamination level)
- System operating hours and duty cycle
- Root cause hypothesis and corrective actions implemented
This institutional knowledge becomes invaluable when evaluating whether to replace failed equipment with identical models or upgrade to higher-specification alternatives.
Predictive Replacement Strategies and Equipment Lifecycle Economics
Once diagnostic data is systematically collected, plant managers can transition from reactive replacement (when failure occurs) to predictive replacement (before failure). This approach minimizes emergency procurement premium costs, allows scheduled installation during planned downtime, and extends average equipment lifespan by 15–25%.
Predictive replacement decisions balance three competing factors: remaining useful life (based on degradation rate), economic lifecycle cost, and operational risk tolerance.
Remaining useful life (RUL) estimation:
If monthly diagnostic measurements show a parameter trending toward a failure threshold, linear regression calculates when that threshold will be crossed. For example, if a pump's vibration amplitude increases 0.5 mm/s per month and the failure threshold is established at 8.0 mm/s while the current level is 4.5 mm/s, RUL = (8.0 − 4.5) ÷ 0.5 = 7 months. Planning replacement for month 6 provides one month of safety margin for procurement and scheduling.
Non-linear degradation (acceleration occurs during final stages) requires more conservative safety margins. Bearings typically degrade slowly for 80% of service life, then fail rapidly. Once acceleration is detected—parameter growth rate increasing month-to-month—replace within 2–4 weeks regardless of absolute threshold values.
The Pratissoli SS71153 industrial pump delivering 122 L/min at 160 bar, operating at 800 rpm, serves applications where failure causes severe production impact. For such critical equipment, predictive replacement occurs at 70–75% of calculated RUL rather than 90%, trading shorter equipment life for virtually eliminated unplanned downtime risk.
Lifecycle cost optimization:
Equipment age alone should not trigger replacement. A pump operating 40 hours/week in a climate-controlled facility with excellent maintenance may remain reliable at 15 years of age, while identical equipment operating 80 hours/week in harsh conditions may require replacement at 5 years. Diagnostic data reveals actual degradation rate independent of calendar age.
Calculate total cost of ownership (TCO) including:
- Equipment acquisition cost
- Installation labor and downtime cost
- Maintenance parts and labor over expected remaining life
- Predicted failure cost (downtime impact, emergency repair premium, expedited shipping)
- Energy consumption difference (new equipment often 5–10% more efficient)
If diagnostic data predicts a $50,000 production loss from unplanned downtime within 6 months, and equipment replacement costs $15,000 installed, the decision favors planned replacement. Conversely, if RUL is estimated at 18 months and replacement cost exceeds the expected failure impact, extending operation with increased monitoring frequency proves more economical.
Implementing a Sustainable Maintenance Culture
Successful predictive replacement strategies require organizational commitment beyond equipment procurement. Plant managers must allocate resources for diagnostic training, establish equipment baseline documentation, and create replacement decision frameworks that balance engineering data against operational and financial constraints.
With 3G Electric's 35-year track record supporting industrial operations globally, we observe that the highest-performing facilities maintain discipline in three areas: comprehensive equipment documentation (nameplate data, purchase dates, modification history), consistent diagnostic measurement protocols (same instruments, same measurement points, same time intervals), and formalized decision criteria (written thresholds triggering maintenance actions rather than individual judgment calls).
Training equipment operators to recognize early failure symptoms—subtle changes in sound, vibration, or fluid condition—extends the time between diagnostic measurements and costs nothing to implement. Many catastrophic failures occur because early warnings were dismissed as normal equipment operation.
Partnership with experienced industrial distributors like 3G Electric provides access to technical expertise when diagnosing failures. Photographs of failed components, fluid samples, and detailed operating parameters can be evaluated remotely to confirm root cause hypotheses and prevent recurrence through targeted specification adjustments in replacement equipment.
The transition from reactive to predictive equipment management fundamentally improves operational reliability and financial performance. Pumps & Compressors represent substantial capital investments; optimizing replacement timing through systematic diagnostics protects this investment and sustains production continuity.