Introduction: Strategic Integration of Pumps & Compressors in Modern Plants
Pumps & Compressors represent two of the most critical mechanical systems in industrial facilities worldwide. Unlike selection or maintenance guides, this article addresses a gap that plant managers face: how to successfully integrate new or replacement equipment into existing systems while establishing robust monitoring frameworks that drive continuous improvement.
With over 35 years of experience as a global industrial equipment distributor, 3G Electric has observed that equipment failures and performance degradation rarely stem from manufacturing defects. Instead, they result from integration challenges—incompatible pressure ratings, mismatched flow requirements, inadequate instrumentation, and poor visibility into operational parameters.
This technical guide focuses on three core competencies plant managers need: system integration protocols, real-time performance monitoring architecture, and data-driven optimization strategies that maximize ROI on Pumps & Compressors investments.
Section 1: System Integration Architecture and Compatibility Assessment
Pre-Integration Compatibility Audits
Before installing any pump or compressor, conduct a comprehensive system audit that documents existing conditions. This goes beyond basic specifications to include:
Pressure System Mapping: Identify every pressure point in your system. For example, if you're upgrading to the Pratissoli KF30 (106 L/min at 200 bar), verify that all downstream components—relief valves, hoses, actuators, and gauges—are rated for 200 bar continuous operation. Many plant failures occur when a new high-pressure pump exceeds the rating of legacy system components rated for 150 bar.
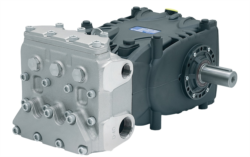
Flow Rate Reconciliation: Match pump displacement with actual demand. The Pratissoli MW40 delivers 211 L/min at 210 bar with 85 kW input power. If your system only requires 150 L/min, this represents oversizing that increases energy costs and equipment wear. Conversely, undersizing creates system lag and forces equipment to operate at maximum capacity continuously.
Thermal Load Analysis: Incompatibility between pump output and system demand generates excess heat. A pump delivering 211 L/min into a system designed for 150 L/min creates relief valve bypass losses—wasting energy and degrading fluid condition. Calculate expected heat generation: excess flow (60 L/min) × pressure (210 bar) × 0.163 conversion factor = approximately 2 kW continuous heat load. Verify your cooling capacity handles this addition.
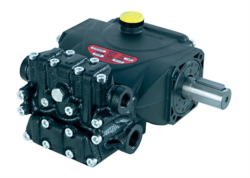
Fluid Compatibility Verification: The Interpump ET1C1612 SX*D20 features PTFE construction specifically for compatibility with certain fluid chemistries. Before integration, verify fluid ISO grade, viscosity index, additive packages, and whether seals on existing equipment match the new pump's material specifications. Mixing incompatible fluids causes seal swelling, erosion, and catastrophic failure.
Mechanical and Control Integration
Physical installation represents only one layer of integration. Control system compatibility often receives insufficient attention:
Pressure Transducer Placement: Install pressure sensors at pump discharge, each major circuit branch, and relief valve inlet. This allows real-time system verification. The Pratissoli SS71153 operating at 800 rpm with 122 L/min flow at 160 bar should maintain consistent discharge pressure. Unexplained pressure fluctuations (variations exceeding ±5%) signal internal pump wear or external circuit issues before catastrophic failure occurs.
Flow Measurement Integration: Beyond discharge sensors, measure flow in each active circuit. This reveals leakage, valve drift, and parasitic losses. If your system has three independent circuits and total measured flow equals 85% of pump displacement, the missing 15% represents unaccounted losses requiring investigation.
Vibration and Temperature Baseline Establishment: Before full operation, establish baseline vibration signatures and bearing temperatures. Document these baselines for the first 50 operating hours, then trend deviations. This becomes the foundation for predictive maintenance outlined in Section 3.
Control Logic Verification: If your compressor or pump operates with automated load-demand switching, verify the control logic matches system characteristics. Overshooting (pump pressure exceeding target by >10 bar) indicates tuning issues. Hunting (repeated pressure cycling within ±15 bar) suggests proportional valve lag or deadband miscalibration.
Section 2: Real-Time Performance Monitoring Architecture
Essential Instrumentation Framework
Modern Pumps & Compressors require comprehensive instrumentation, not just operational gauges:
Multi-Parameter Data Collection: Minimum viable monitoring captures discharge pressure, system flow, bearing temperature, motor current, and pump speed. For the Interpump E1D1808 L compact gear pump operating at 2800 rpm with 2.72 kW input, document baseline current draw (typically 4-5 amps). Motor current exceeding baseline by >10% signals increased internal friction from wear or contamination.
Condition-Based Thresholds: Establish alert thresholds for each parameter based on equipment specifications and operational history:
- Pressure deviation exceeding ±8% from setpoint
- Temperature rise >15°C above baseline
- Motor current increase >12% from baseline
- Vibration spectral peaks appearing outside historical envelopes
- Flow rate declining >5% month-over-month
These thresholds trigger investigation before emergency repairs become necessary.
Data Logging and Trend Analysis: Connect instrumentation to a central data logging system (SCADA, PLC, or dedicated monitoring platform). Automated data collection at 10-60 second intervals creates 2,000-8,600 data points daily per pump, enabling precise trend analysis. Over 30 days, detect gradual wear patterns that manual daily checks miss entirely.
Performance Benchmarking Methodology
Instrument readings only create value when compared against benchmarks:
Energy Efficiency Tracking: Calculate actual power consumption relative to theoretical minimum. For the Pratissoli KF30 rated at 40 kW input delivering 106 L/min at 200 bar:
- Theoretical hydraulic power = (200 bar × 106 L/min) ÷ 600 = 35.3 kW
- Typical efficiency = 88% (35.3 ÷ 40)
- If measured efficiency drops to 80%, investigate internal wear or external leakage
Seasonal and Load-Based Normalization: Pump efficiency varies with ambient temperature, fluid temperature, load factor, and duty cycle. Document performance across operating conditions, then establish normalized baselines. A pump operating continuously at 80% displacement efficiency differs fundamentally from one operating intermittently at peak displacement—both are normal depending on context.
Automated Alert Generation
Data collection without action creates false security. Configure automated notifications:
- Immediate Alerts (0-5 minutes): Pressure spikes exceeding 110% of setpoint, loss of flow signal, motor overload, temperature exceeding 70°C
- Urgent Alerts (1-4 hours): Sustained pressure deviation, performance metric degradation >15%, abnormal vibration patterns
- Advisory Alerts (daily/weekly): Trending toward thresholds, efficiency creep, cumulative operating hours approaching service intervals
Proper alert prioritization prevents alarm fatigue while ensuring critical issues receive immediate attention.
Section 3: Optimization Strategies and System Tuning
Pressure and Flow Optimization
After integration and initial monitoring, optimization begins with careful analysis:
Pressure Reduction Initiatives: Many systems operate at maximum rated pressure from inertia rather than necessity. If your process requires 180 bar maximum but the system maintains 200 bar setpoint, reducing setpoint to 185 bar (if all components permit) reduces power consumption by approximately 2.5% and extends seal life 20-30%. For a 40 kW pump, this saves ~1 kW continuously.
Load-Responsive Control Tuning: Variable displacement pumps (such as Pratissoli Series equipment) include compensator mechanisms. If your system experiences pressure oscillations or responds sluggishly to load changes, compensator tuning may be required. Small adjustments to spring preload or orifice sizing dramatically improve stability without equipment replacement.
Flow Balancing Across Circuits: Multi-circuit systems rarely distribute flow equally. Measure actual flow to each circuit under representative loads. If Circuit A receives 60 L/min while designed for 80 L/min, investigate flow control valve settings or orifice sizing. Rebalancing improves throughput consistency and cycle time performance.
Contamination Control Integration
Fluid contamination degrades Pumps & Compressors performance more than any other single factor:
Baseline Fluid Analysis: Conduct ISO 4406 particle count analysis (measure particles >4, >6, and >14 microns). Establish baseline at commissioning. For Pratissoli equipment operating at 160-210 bar, maintain ISO 18/16/13 or cleaner (critical for piston pump longevity).
Filter Upgrade Analysis: Many facilities operate standard return filters (25-10 micron nominal). Calculate upgrade ROI: if higher filtration (3 micron absolute) extends pump overhaul intervals from 5,000 to 8,000 hours and costs $3,000 annually, the payback period is straightforward when compared against $15,000-20,000 overhaul costs.
Condition Monitoring Integration: Particle counting, ISO grades, water content, and viscosity tracking reveal contamination progression. Monthly analysis costs $50-150 per sample but prevents $25,000+ pump failures.
Thermal Management Optimization
Excess heat is a silent killer of Pumps & Compressors performance:
Heat Load Calculation: Excess flow bypass through relief valves generates heat. If a 211 L/min pump (MW40) operates against 210 bar with 60 L/min constant bypass, thermal load = 60 × 210 ÷ 600 = 21 kW continuous heat generation. Verify your cooler capacity. For every 10°C rise above 55°C operating temperature, seal life decreases 30-40%.
Cooler Performance Trending: Plot fluid temperature over weeks and months. Cooling capacity degradation (cooler fan failures, air-side fouling, coolant blockage) appears as gradual temperature creep. Detecting 2-3°C increases over 60 days allows maintenance scheduling before fluid reaches 70°C and accelerates wear.
Seasonal Adjustments: Ambient temperature variations require compensator and relief valve recalibration twice annually. Summer operation may require setpoint reduction; winter may require cooler thermostat adjustment.
Section 4: Diagnostic Frameworks and Continuous Improvement
Systematic Troubleshooting Protocols
When performance anomalies appear, structured investigation prevents cascading failures:
Symptom → Root Cause Mapping: Document all observed symptoms with timestamps—pressure variations, noise changes, temperature spikes, flow inconsistencies. Cross-reference against maintenance logs, recent changes, and control system records. A pressure spike after a valve adjustment represents one failure mode; the same pressure spike after 2,000 hours of operation suggests pump wear.
Isolation Testing: Never assume pump failure. Verify relief valve functionality (crack pressure accuracy), check downstream component condition, and confirm fluid contamination status before assuming internal pump damage. A blocked filter behind a pressure transducer creates false readings that trigger unnecessary pump replacement.
Performance Regression Analysis: When equipment performance degrades, establish degradation rate. A pump losing 1% efficiency monthly represents controlled wear; the same pump losing 5% monthly signals cavitation, contamination, or imminent failure. Early detection allows planned maintenance rather than emergency replacement.
Industry Best Practices from 35+ Years Experience
Throughout three decades distributing Pumps & Compressors globally, 3G Electric has documented patterns that distinguish well-run operations from problem-prone facilities:
Preventive Documentation: Facilities maintaining detailed commissioning records (baseline readings, calibration certificates, technical documentation) resolve 60% of issues through systematic analysis rather than hardware replacement.
Cross-Functional Communication: Plant engineers, maintenance technicians, and operators must share performance data and observations. Operators detect noise changes and anomalies long before instruments register them. Integrate operational observations into the technical record.
Scheduled System Audits: Annual comprehensive audits (pressure system integrity, control logic verification, fluid condition, component wear assessment) cost $2,000-3,000 but prevent $50,000+ emergency replacements. Audits should include third-party verification to eliminate internal bias.
Supply Chain Reliability: Establish relationships with distributors maintaining equipment expertise, not merely inventory. When equipment requires service, rapid access to Pratissoli KF30, Pratissoli MW40, Interpump E1D1808 L, and other critical components ensures minimum downtime.
Conclusion: Strategic Thinking About Pumps & Compressors Integration
Successful Pumps & Compressors integration transcends equipment selection. Plant managers who excel at system integration, establish comprehensive monitoring architecture, and implement data-driven optimization achieve 15-25% energy efficiency improvements, extend equipment life 30-40%, and reduce unplanned downtime 50% or more.
The investment in integration planning, instrumentation, and monitoring discipline delivers measurable returns within 12-18 months. More importantly, it shifts operations from reactive crisis management to proactive performance optimization—the hallmark of world-class industrial facilities.