Understanding Diagnostic Testing Fundamentals for Pumps & Compressors
Pumps & Compressors represent critical infrastructure in manufacturing, processing, and utility operations worldwide. Unlike preventive maintenance schedules or troubleshooting reactive approaches, diagnostic testing is a proactive methodology that validates equipment performance against manufacturer specifications before operational degradation becomes evident. For maintenance teams managing diverse pump and compressor fleets, systematic diagnostics reduce unplanned downtime by 40-60% while extending equipment lifecycle.
Diagnostic testing differs from routine maintenance. While preventive maintenance focuses on component replacement at predetermined intervals, diagnostic testing measures actual performance metrics—flow rates, pressure differentials, temperature gradients, vibration signatures, and power consumption—to determine remaining useful life and predict failure windows. This distinction is critical: a pump may pass visual inspection and routine maintenance yet exhibit declining performance that diagnostics would reveal.
3G Electric's three decades of global equipment distribution has demonstrated that maintenance teams achieving highest reliability implement quarterly diagnostic protocols on critical pumps and compressors. These aren't complex procedures requiring specialized technicians; rather, they're systematic measurement and analysis routines that in-house teams execute using standard instrumentation.
Core Diagnostic Measurements for Pump Performance Validation
Pressure and Flow Rate Analysis
The foundation of pump diagnostics involves simultaneous measurement of discharge pressure and flow rate. These parameters directly indicate pump health and load characteristics. Install pressure gauges on inlet and discharge lines; the differential pressure reveals whether the pump develops expected head for its operating point. Flow measurement requires inline flowmeters or calculated flow based on motor current and known pump displacement.
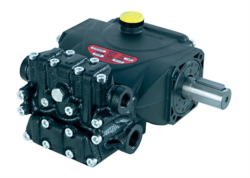
For reciprocating pumps like the Interpump PUMP E3B2515I R, measure discharge pressure at three load points: 25%, 50%, and 75% of rated flow. Declining pressure at constant flow indicates internal leakage or valve degradation. Record trending data monthly; pressure decline exceeding 10% over six months typically signals imminent component wear requiring intervention.
Centrifugal pump diagnostics require establishing the pump's performance curve. Plot three measurements: minimum flow (near shutoff), nominal operating point (100% rated capacity), and maximum continuous flow. Compare actual curve against manufacturer documentation. Right-shifted curves indicate cavitation or inlet blockage; left-shifted curves suggest discharge-side restriction or internal impeller damage.
Temperature Monitoring and Thermal Analysis
Fluid temperature is the earliest indicator of internal friction increases. Install thermal sensors on pump outlet and compressor discharge lines. Temperature rises of 5-10°C above baseline typically indicate internal leakage or bearing degradation. For gear-driven units like the Interpump PUMP E3B1515 DX with Gearbox RS500H, monitor gearbox sump temperature as a primary diagnostic; temperatures exceeding 65°C (150°F) suggest inadequate cooling or gear mesh issues.
Implement thermal trending: record temperature at fixed operating conditions weekly. Temperature trending reveals degradation patterns invisible in single-point readings. Rising trends warrant investigation; temperature plateaus after initial rise typically indicate system stabilization and acceptable conditions.
Vibration Signature Analysis
Vibration diagnostics separate normal operational characteristics from incipient failure modes. Acquire vibration data in three orthogonal axes (vertical, horizontal, axial) using portable vibration meters. Measure velocity (inches/second) and acceleration (g-force) across frequency ranges 10 Hz to 10 kHz.
Baseline vibration signatures, established during equipment commissioning, provide comparison standards. Velocity increases of 50% above baseline indicate bearing wear or impeller imbalance. Acceleration spikes at specific frequencies indicate developing gear damage (reciprocating frequency multiples) or blade passage frequencies for centrifugal units.
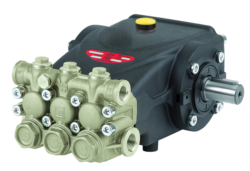
For units like the Interpump PUMP E3C1515 L, establish baseline immediately after installation. Acquire measurements at minimum monthly intervals on critical equipment. Trend vibration over six-month periods; gradual increases followed by rapid rises indicate bearing degradation requiring scheduled replacement before catastrophic failure.
Power Consumption and Efficiency Testing
Electrical power input directly reflects mechanical output plus losses. Using calibrated power meters, record three-phase voltage, current, and power factor simultaneously with pressure and flow measurements. Calculate pump efficiency: Efficiency (%) = (Pressure × Flow) / (Electrical Power × 1715) for US customary units.
Efficiency decline indicates internal losses increasing. A 5% efficiency loss suggests bearing drag or internal leakage development. A 15% loss signals major internal damage or cavitation. This measurement is particularly valuable because it's non-intrusive and quantifiable without system shutdown.
Diagnostic Protocols for Different Pump and Compressor Types
Reciprocating Pump Diagnostics
Reciprocating units like the Interpump PUMP E3B2515 L require measurement of pump outlet pressure ripple and pulsation. Discharge pressure should oscillate within ±5-10% of nominal; larger variations indicate valve malfunction or piston ring wear. Install high-frequency pressure transducers (sampling 1000+ Hz) and capture waveforms over 10 pump cycles.
Analyze valve performance by measuring pressure rise time: the duration for discharge pressure to transition from zero to nominal. Slow rise times indicate intake valve sluggishness or discharge valve stiction. Excessive pulsation suggests worn check valves or broken springs.
For multi-cylinder units, measure individual cylinder contribution by observing pressure waveforms. Equal amplitude indicates balanced cylinder function; unequal amplitudes suggest piston ring wear in lower-pressure cylinders.
Centrifugal Pump Diagnostics
Centrifugal pumps require performance curve generation. Simultaneously measure head (pressure differential × fluid specific weight), flow rate, and motor power across throttled operating points from shutoff to maximum continuous flow. Plot head versus flow; compare curve shape against manufacturer documentation.
Cavitation detection involves monitoring discharge pressure stability. Cavitation causes sudden pressure fluctuations and audible noise. Lower pump inlet pressure gradually while monitoring pressure stability; cavitation onset pressure indicates inadequate inlet conditions. Acceptable operations maintain inlet pressures 3-5 PSI above vapor pressure.
Positive Displacement Pump Diagnostics
For units like the Interpump PUMP E3C1021 DX with Valve, measure internal leakage by measuring volume flow at constant discharge pressure. Increase discharge pressure in 500-PSI increments; plot flow versus pressure. Steeper slopes indicate increased internal leakage. Compare slopes against baseline; a 20% increase suggests seal or bushing wear.
Compressor Diagnostics
Compressor diagnostic testing measures pressure build rates, inter-stage temperatures, and power consumption during loaded operation. During loaded cycles, discharge pressure should rise from low pressure cutoff to high pressure setpoint within 30-60 seconds; slower rise indicates valve leakage or compression inefficiency. Inter-stage temperatures (between compressor stages) should not exceed 120°C; higher temperatures indicate poor inter-cooling or compression inefficiency.
Measure unloaded run times; compressors should cycle to unload within 5-10 minutes of reaching high pressure. Extended loaded runtime indicates internal leakage in discharge check valves or cutoff valves.
Implementing Systematic Diagnostic Programs
Establishing Baseline Data
Systematic diagnostics require baseline comparisons. During equipment commissioning, or immediately upon acquiring used equipment, record complete diagnostic measurements under controlled operating conditions. Document ambient temperature, inlet conditions, load percentage, and fluid type. This baseline becomes the reference for all future trending.
Maintain diagnostic records in centralized databases accessible to maintenance teams. Include timestamp, operator name, measurement parameters, and ambient conditions. This documentation enables trend analysis across years and supports predictive analytics.
Measurement Intervals and Scheduling
Critical pumps and compressors warrant quarterly diagnostics. Standard equipment requires semi-annual testing. Standby equipment requires annual validation. Increase measurement frequency if trend analysis reveals concerning slopes or after equipment repairs.
Schedule diagnostics during predictable operating windows when loads are stable and temperatures are equilibrated. Avoid measurements immediately after startup or during load transients; these create measurement noise obscuring true equipment condition.
Data Interpretation and Decision Frameworks
Establish alert thresholds for each measurement parameter. Example thresholds: pressure decline >10% from baseline, temperature increase >10°C, vibration velocity increase >50%, efficiency decline >10%, flow decline >5%. When any threshold is exceeded, escalate to engineering for root cause analysis.
Differentiate between measurement error and genuine degradation. Validate unusual readings through repeated measurements before escalating. Temperature spikes from ambient fluctuations should not trigger alarms; sustained elevated temperature requires investigation.
Implement trend-based decision logic: linear decline over months typically indicates gradual wear warranting scheduled replacement; abrupt changes suggest acute failures requiring immediate attention. Equipment exhibiting stable parameters despite reaching service life recommendations should remain in service unless specific degradation appears.
Leveraging 3G Electric's Technical Support for Diagnostic Programs
With 35+ years of global industrial equipment distribution, 3G Electric maintains technical resources supporting maintenance team diagnostic programs. Our global networks provide access to manufacturer documentation, performance specifications, and technical consultation for complex diagnostic interpretation.
When diagnostic testing reveals concerning trends, contact 3G Electric technical support with your measurement data and baseline comparisons. Our specialists assist with root cause analysis and recommend component replacement or repair strategies. We maintain inventory of replacement components for all Interpump pump models, enabling rapid component sourcing when diagnostics indicate required maintenance.
For organizations establishing new diagnostic programs, 3G Electric provides training support on measurement methodologies, data management, and interpretation frameworks. This training accelerates program implementation and ensures consistent, accurate measurement practices across maintenance teams.