Understanding Measurement & Detection in Modern Maintenance Strategy
Measurement & Detection systems form the backbone of predictive maintenance, yet many maintenance teams operate them in isolation. Temperature sensors report independently from pressure transmitters. Flow probes work separately from thermal cameras. This fragmented approach leaves critical failure signatures undetected.
Over 35 years, 3G Electric has supplied industrial teams with measurement equipment that works best when integrated. The most effective maintenance programs don't just collect data—they correlate it. A bearing temperature rising 15°C combined with increasing vibration and changing flow patterns tells a different story than temperature alone.
This article covers practical strategies for combining multiple measurement channels into actionable diagnostics that your team can implement immediately, regardless of equipment age or facility size.
Thermal Imaging as Primary Detection Layer
Why Temperature Detection Matters First
Temperature is the earliest warning sign for most industrial equipment failures. Electrical resistance increases, friction accelerates, and chemical reactions intensify before mechanical symptoms appear. By the time noise or vibration becomes noticeable, damage is often already underway.
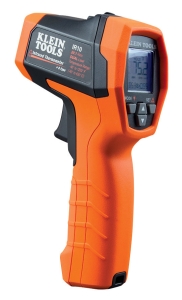
Thermal imaging detects this invisible precursor stage. Unlike contact temperature probes that measure one point, thermal cameras capture the entire thermal signature of equipment, revealing hot spots that indicate:
- Bearing degradation: Localized heating shows wear before noise develops
- Electrical connection failures: Corroded terminals and loose lugs generate heat long before circuit failure
- Insulation breakdown: Temperature rise in motor windings precedes catastrophic short circuits
- Seal deterioration: Heat patterns reveal where friction is increasing in pumps and compressors
- Flow restrictions: Blocked lines and filter saturation create thermal signatures before pressure alarms trigger
Implementing Thermal Detection Protocols
Establish baseline thermal images of all critical equipment during normal operation. Store these as reference. During monthly rounds, capture thermal images from the same positions and distances. Compare against baseline—changes of 5-10°C often indicate emerging problems.
For HVAC and heating systems, pair thermal imaging with temperature probes like the Dwyer PT100 OHM RTD temperature probe. The probe provides precise numerical data at specific points, while thermal imaging contextualizes that data across the entire component. Together, they answer: "Is this localized hot spot or system-wide temperature rise?"
Thermal imaging also validates other measurement readings. If your differential pressure transmitter shows increasing pressure drop across a heat exchanger, thermal imaging confirms whether fouling or blockage is actually occurring—or whether the transmitter itself needs recalibration.
Multi-Sensor Integration: Correlating Pressure, Flow, and Temperature
The Power of Correlated Data
When maintenance teams measure only pressure, they see incomplete information. A pressure gauge reading high could mean:
- Actual system overpressure requiring relief
- Gauge calibration drift
- Temperature change affecting fluid density
- Blockage downstream
- Pump cavitation
Adding flow and temperature measurement eliminates guesswork. The Dwyer 616KD-13V-TC differential pressure transmitter measures pressure drop across HVAC components. Pairing it with the Dwyer MAFS-16 metal average flow probe reveals whether pressure change correlates with actual flow changes or indicates filter loading, fouling, or equipment degradation.
Here's a practical scenario: Your expansion tank system shows rising pressure. Is it a safety concern or normal operation? Check three parameters simultaneously:
1. Temperature using a calibrated RTD probe
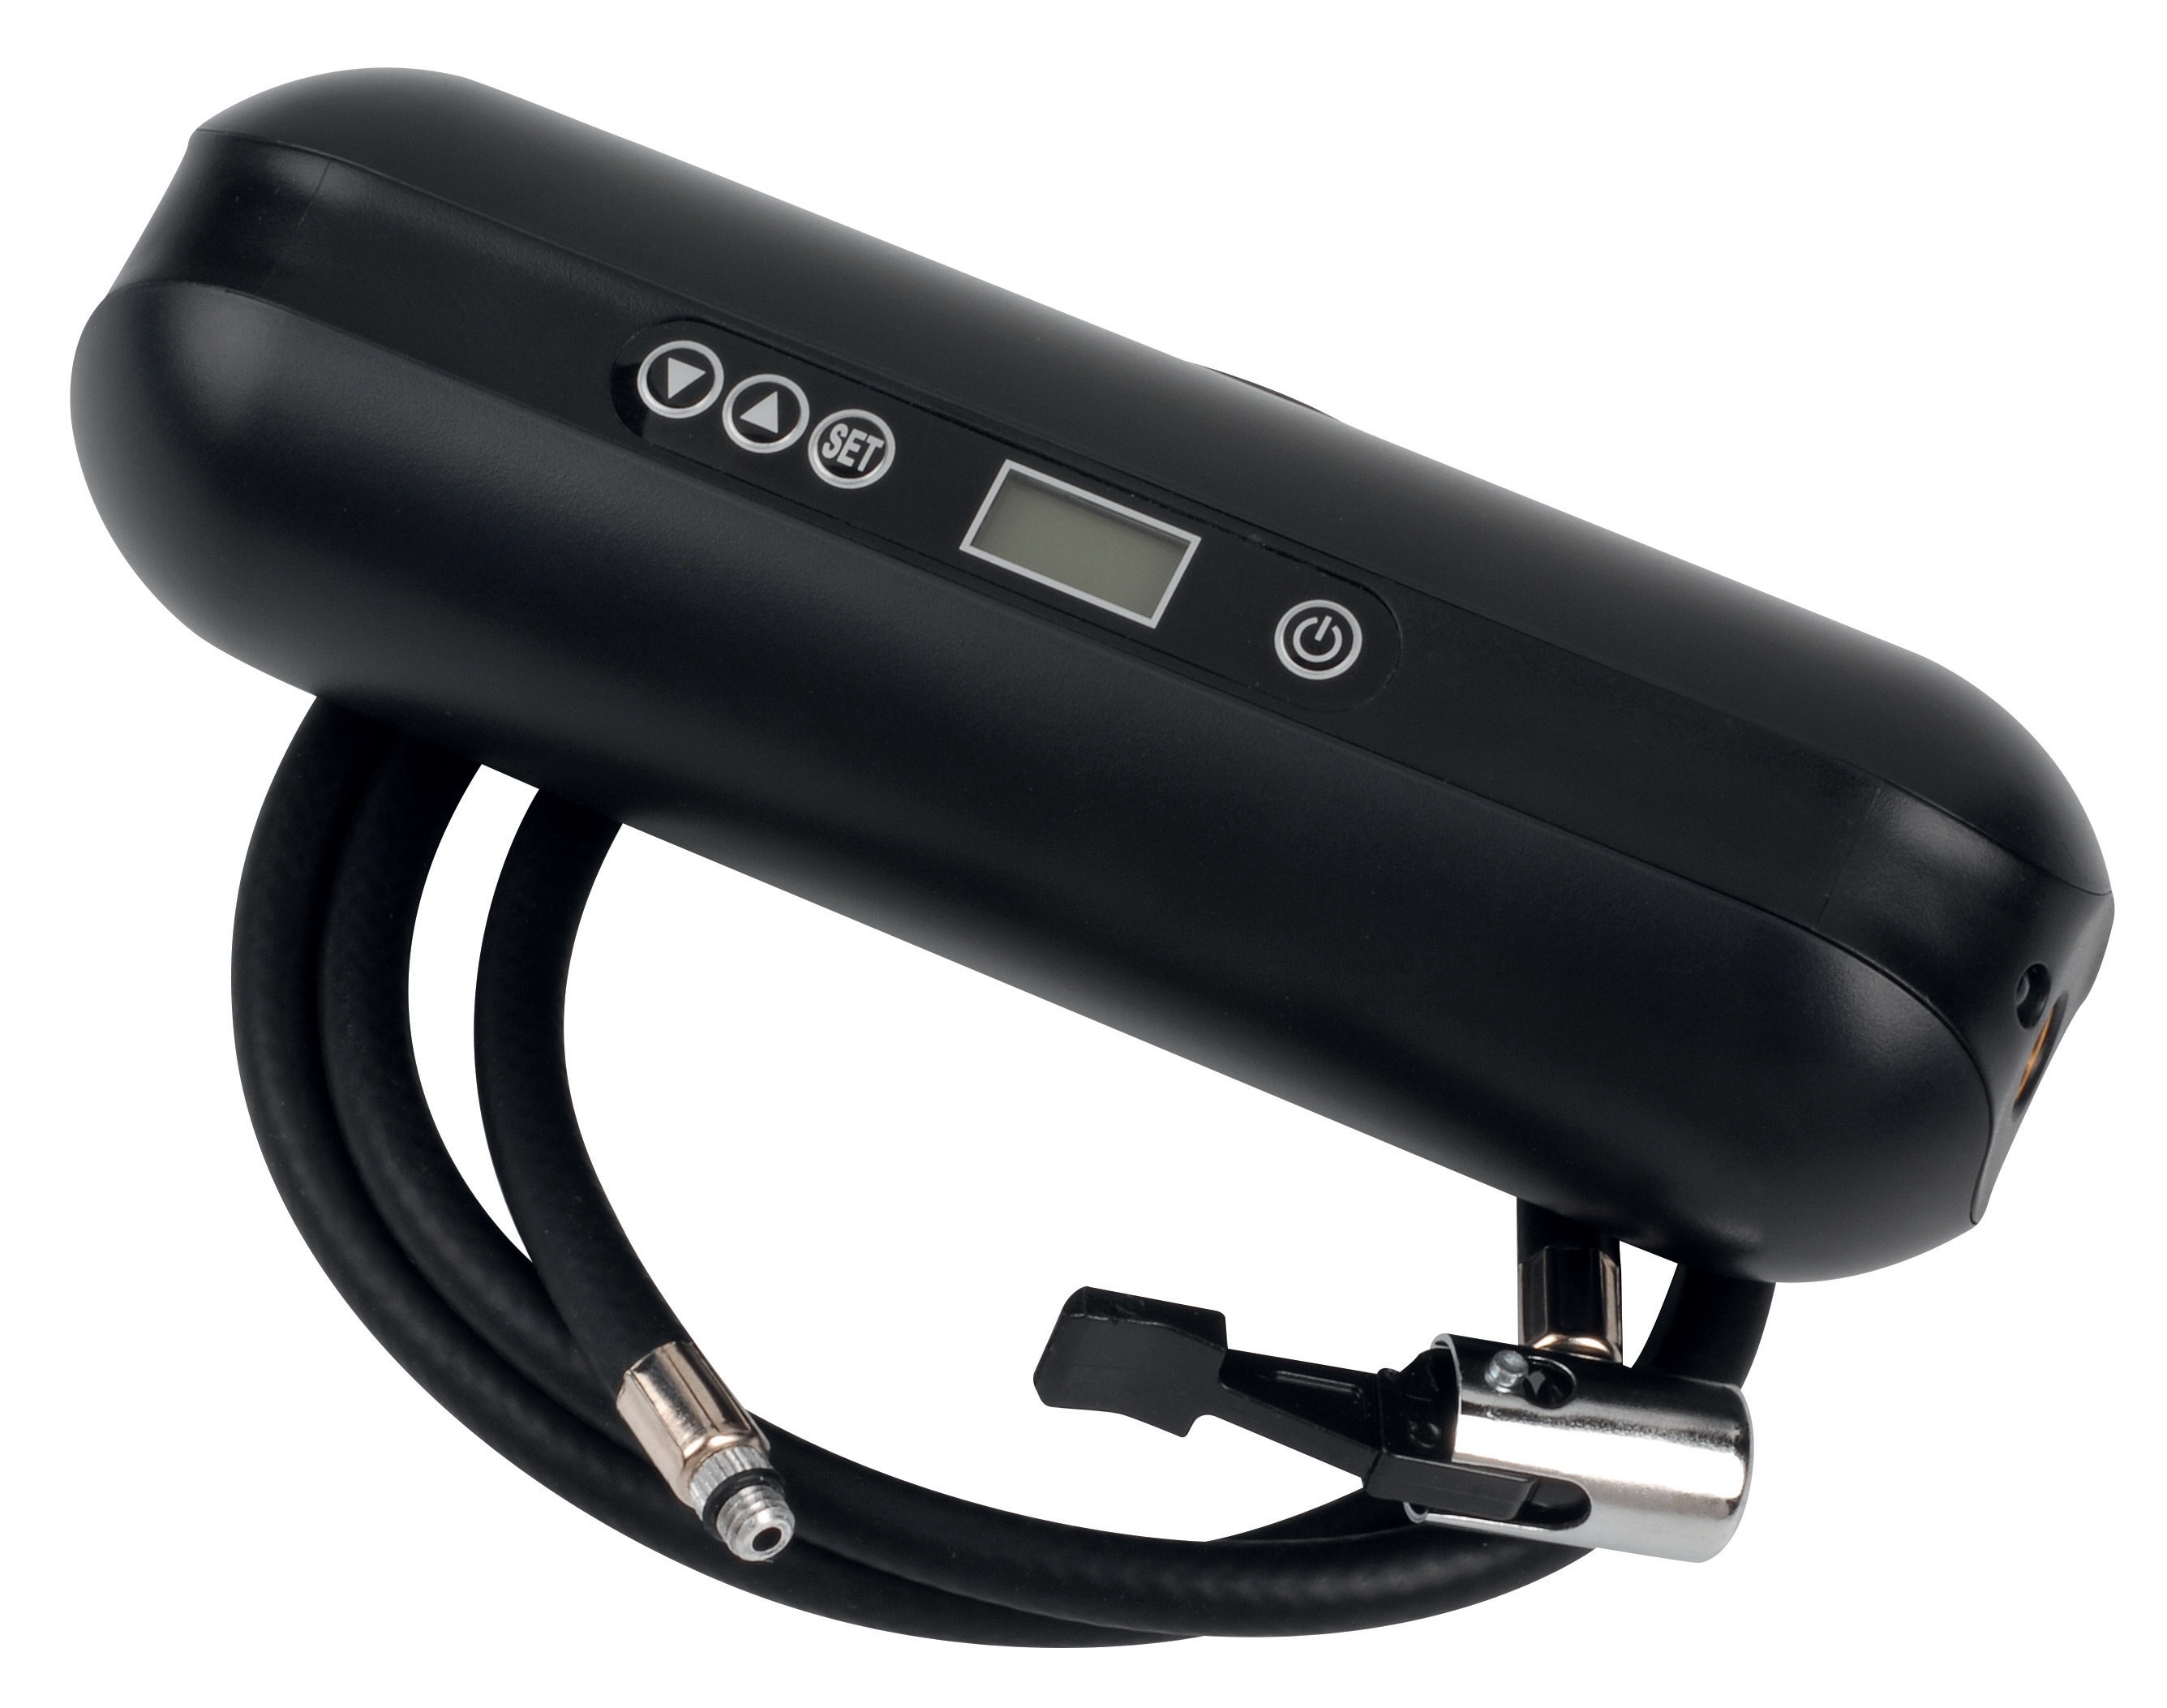
2. Actual fluid volume using the CBM expansion tank inflator with 2000 mAH battery
3. Pressure relief activity by observing the Preciman stainless steel vertical pressure gauge during system cycling
Together, these measurements tell whether pressure rise is expected (thermal expansion from heated fluid), equipment failure (loss of gas charge in expansion tank), or system misconfiguration.
Building Your Multi-Sensor Baseline
Effective measurement & detection starts with comprehensive baseline data captured during normal operation:
- Record pressure, temperature, and flow simultaneously across all critical points
- Document seasonal variations—HVAC systems behave differently in winter versus summer
- Note how parameters respond to load changes
- Establish alarm thresholds based on your specific equipment, not manufacturer defaults
- Photograph thermal images and gauge readings side-by-side with timestamp
This baseline becomes your diagnostic reference. Deviations from baseline—not absolute values—trigger investigation.
Practical Diagnostic Workflows for Maintenance Teams
Monthly Thermal Inspection Routine
Step 1: Capture thermal baseline (10-15 minutes per equipment area)
Use consistent camera distance and angle. Photograph the pressure gauge and temperature probe readings in the same images to correlate thermal findings with point measurements.
Step 2: Log pressure and flow (5 minutes)
Record differential pressure transmitter output and flow probe readings. Compare against previous month. Changes of more than 10% warrant detailed investigation.
Step 3: Cross-reference equipment thermal signature (5 minutes)
Note any new hot spots, increased intensity in existing hot areas, or asymmetric heating patterns. Temperature variations larger than 15°C across similar components signal problems.
Step 4: Document findings and trends (5 minutes)
Store data in simple spreadsheet or maintenance software. Track changes month-to-month. One anomaly means nothing; a trend over three months indicates developing failure.
Quarterly Multi-Sensor Deep Diagnostic
Every quarter, perform integrated analysis:
1. Compare all measurement channels: Does rising pressure correlate with rising temperature? Does increasing flow pressure-drop coincide with decreasing thermal efficiency?
2. Check sensor calibration: Use the CBM expansion tank inflator to verify tank gas precharge matches design specifications. Confirm RTD probe reads within ±0.6% accuracy. Verify transmitter output matches independent gauge readings.
3. Identify correlation failures: If pressure rises but temperature and flow don't change, suspect gauge error or local blockage. If temperature rises but pressure stays stable, check for internal fouling or friction.
4. Adjust thresholds: If equipment consistently operates 5°C higher than baseline but shows no degradation signs, adjust your alert thresholds to prevent false alarms.
Troubleshooting Common Measurement Discrepancies
Problem: Differential pressure transmitter shows high pressure drop, but flow probe indicates normal flow.
Diagnosis: Filter saturation or localized blockage. Thermal imaging confirms by showing temperature rise immediately downstream of blockage point.
Action: Inspect and clean filter. Reestablish baseline readings.
---
Problem: Temperature probe reads high, but thermal camera shows normal equipment temperatures.
Diagnosis: Probe contact issue (corroded connector, thermal paste degradation) or sensor calibration drift.
Action: Clean probe connection, verify contact with equipment surface, compare against pressure gauge and flow readings. Replace probe if discrepancy persists.
---
Problem: Expansion tank pressure slowly increases every month despite temperature stability.
Diagnosis: Loss of gas charge in expansion tank. The CBM inflator will reveal actual precharge pressure versus design specification.
Action: Measure precharge with inflator tool. If below design spec (typically 0.5-1.0 bar less than system operating pressure), recharge to proper level.
Integration with 3G Electric's 35-Year Supplier Experience
Measurement equipment quality compounds in value over time. Inferior gauges drift unpredictably, causing false alarms. Cheap temperature probes accumulate calibration error. As your 3G Electric distributor since 1990, we've seen which products maintain accuracy across years and which degrade quickly.
The products referenced throughout this article—Dwyer PT100 probes, differential pressure transmitters, Preciman pressure gauges, flow probes, and expansion tank inflators—are selected specifically because they maintain calibration stability, withstand industrial environments, and integrate well into multi-sensor systems.
When you standardize on compatible equipment, your maintenance team develops deep familiarity with how each sensor behaves. You recognize genuine problems faster because you know which measurement patterns mean trouble and which represent normal operation variance.
Actionable Next Steps for Your Maintenance Team
1. Identify your three most critical equipment pieces—typically a main circulation pump, air handler, and boiler in HVAC systems, or primary compressor and distribution manifold in pneumatic systems.
2. Establish baseline measurement data: Pressure, temperature, and flow during normal operation. If possible, capture thermal images.
3. Create a simple measurement log: Month, date, time, pressure reading, temperature reading, flow reading (if applicable), thermal observations, and notes. This need not be sophisticated—a spreadsheet works perfectly.
4. Set correlation rules: Document what measurement combinations indicate specific problems. For example: "Pressure increasing + Temperature increasing + Flow normal = likely heat exchanger fouling."
5. Schedule monthly thermal inspection rounds following the protocols outlined above.
6. Review trends quarterly and adjust maintenance schedules based on what your measurements reveal. Equipment showing increasing degradation trends gets serviced sooner; stable equipment intervals can extend slightly.
Measurement & Detection effectiveness compounds when data becomes routine and comparison becomes automatic. Your first month of detailed measurement work seems time-consuming. By month six, you've prevented equipment failures that would have cost 10-20 times your measurement investment.