Understanding Measurement & Detection in Equipment Reliability
Measurement & Detection technology represents one of the most cost-effective investments a maintenance team can make in equipment longevity and operational continuity. Rather than waiting for equipment failure, modern measurement systems provide continuous visibility into system performance through multiple parameters—temperature, pressure, flow rate, and electrical characteristics—that collectively paint a complete picture of equipment health.
With over 35 years of experience distributing industrial equipment across Southeast Asia, 3G Electric has observed a clear pattern: maintenance teams that implement robust measurement and detection protocols reduce unplanned downtime by 40-60% compared to reactive maintenance approaches. The difference lies not in the equipment itself, but in how facilities interpret and act upon the data these systems provide.
The fundamental principle behind effective measurement and detection is redundancy through diversity. A single temperature reading tells you the current state; combining temperature data with pressure measurements and flow rate information reveals the trajectory of system degradation. This multi-parameter approach transforms measurement from a simple check into a predictive intelligence system.
Multi-Parameter Monitoring: Building Your Detection Framework
Temperature as the Primary Diagnostic Indicator
Temperature serves as the earliest warning system in most industrial equipment. The Dwyer PT100 OHM RTD temperature probe offers ±0.6% accuracy across a -35.5 to +115.5°C range, making it suitable for both HVAC systems and critical process monitoring. What makes temperature measurement particularly valuable is its consistency—temperature changes follow predictable patterns during equipment degradation.
For maintenance teams, the strategy is establishing baseline temperatures under normal operating conditions, then monitoring for anomalous deviations. A 5-10°C increase in bearing temperature, compressor discharge, or heat exchanger outlet suggests mechanical friction, refrigerant issues, or heat transfer degradation respectively. The PT100 probe's flexible copper capillary design allows installation in tight spaces where problems often develop first.
Pressure Monitoring as Real-Time System State
Pressure measurement provides immediate feedback on system loading and mechanical condition. The Preciman stainless steel vertical pressure gauge (D63, 0/+40 mbar) delivers ±1.6% accuracy for low-pressure applications common in HVAC and pneumatic systems. The critical insight for maintenance teams: pressure variations occur before temperature changes, making them leading indicators of problems.
Consider an HVAC system where discharge pressure gradually increases over weeks. This typically indicates refrigerant overcharge, condenser fouling, or TXV malfunction—none immediately visible through temperature observation alone. By monitoring pressure trends through a calibrated gauge, technicians gain 2-3 weeks' advance warning before the system temperature rises dangerously.
The Dwyer 616KD-13V-TC differential pressure transmitter extends this capability by measuring pressure differences across critical system components. In air distribution systems, this reveals filter loading conditions, ductwork blockages, or coil fouling with extreme sensitivity—essential data for HVAC maintenance when standard pressure gauges cannot detect subtle changes.
Flow Rate as the Integration Point
Flow measurement synthesizes temperature and pressure data into actionable insight. The Dwyer MAFS-16 metal average flow probe measures static and total pressure across a 16 cm probe length, enabling technicians to calculate actual volumetric flow rates in air distribution applications.
Why is this critical? A compressor may maintain normal discharge pressure, temperature may remain within specification, but if actual flow rate has dropped 20%, the system is slowly failing. This scenario—high efficiency masking developing problems—catches reactive maintenance teams entirely unprepared. Flow measurement bridges the gap between component condition and system output.
Practical Implementation: Setting Up Detection Monitoring
Baseline Establishment Protocol
Before implementing any detection system, establish clear baselines during optimal operating conditions:
- Record all measurement parameters across 5-7 days of normal operation under consistent load conditions
- Identify natural variation ranges (not all variance indicates problems; systems have legitimate cycles)
- Document ambient conditions that affect measurements (outdoor temperature, humidity, facility load patterns)
- Establish alert thresholds at 80% of failure points, giving maintenance teams response time before catastrophic failure
This foundation prevents false alarms that undermine confidence in measurement systems and trigger unnecessary service calls.
Trend Analysis Over Fixed-Point Measurement
Maintenance teams often make a critical error: focusing on individual readings rather than trends. A temperature reading of 45°C means nothing without context. The same reading increasing from 35°C over the past month means everything—it signals developing problems.
Implement a simple spreadsheet-based tracking system (or integrate with CMMS if available) that captures measurements on consistent schedules—daily, weekly, or monthly depending on system criticality. Plot these over time. The graph itself becomes a diagnostic tool: a sharp slope indicates acute failure development, while gentle slopes suggest normal aging.
Measurement Point Placement Strategy
Where you install detection equipment determines what you can diagnose:
- Inlet and outlet measurements (both temperature and pressure) reveal heat transfer or pressure drop efficiency
- Intermediate points identify localized degradation—a compressor discharge temperature spike suggests compressor problems, while only outlet temperature elevation suggests system backpressure
- Return path monitoring detects contamination or system circulation issues
For HVAC systems using the flow probe, positioning across the main ductwork rather than individual branches provides system-wide performance metrics, reducing the number of individual measurement points while maintaining diagnostic power.
Equipment Selection and Integration with 3G Electric
3G Electric's 35+ years of experience in industrial distribution means understanding not just what equipment to specify, but how different measurement systems integrate into coherent monitoring frameworks.
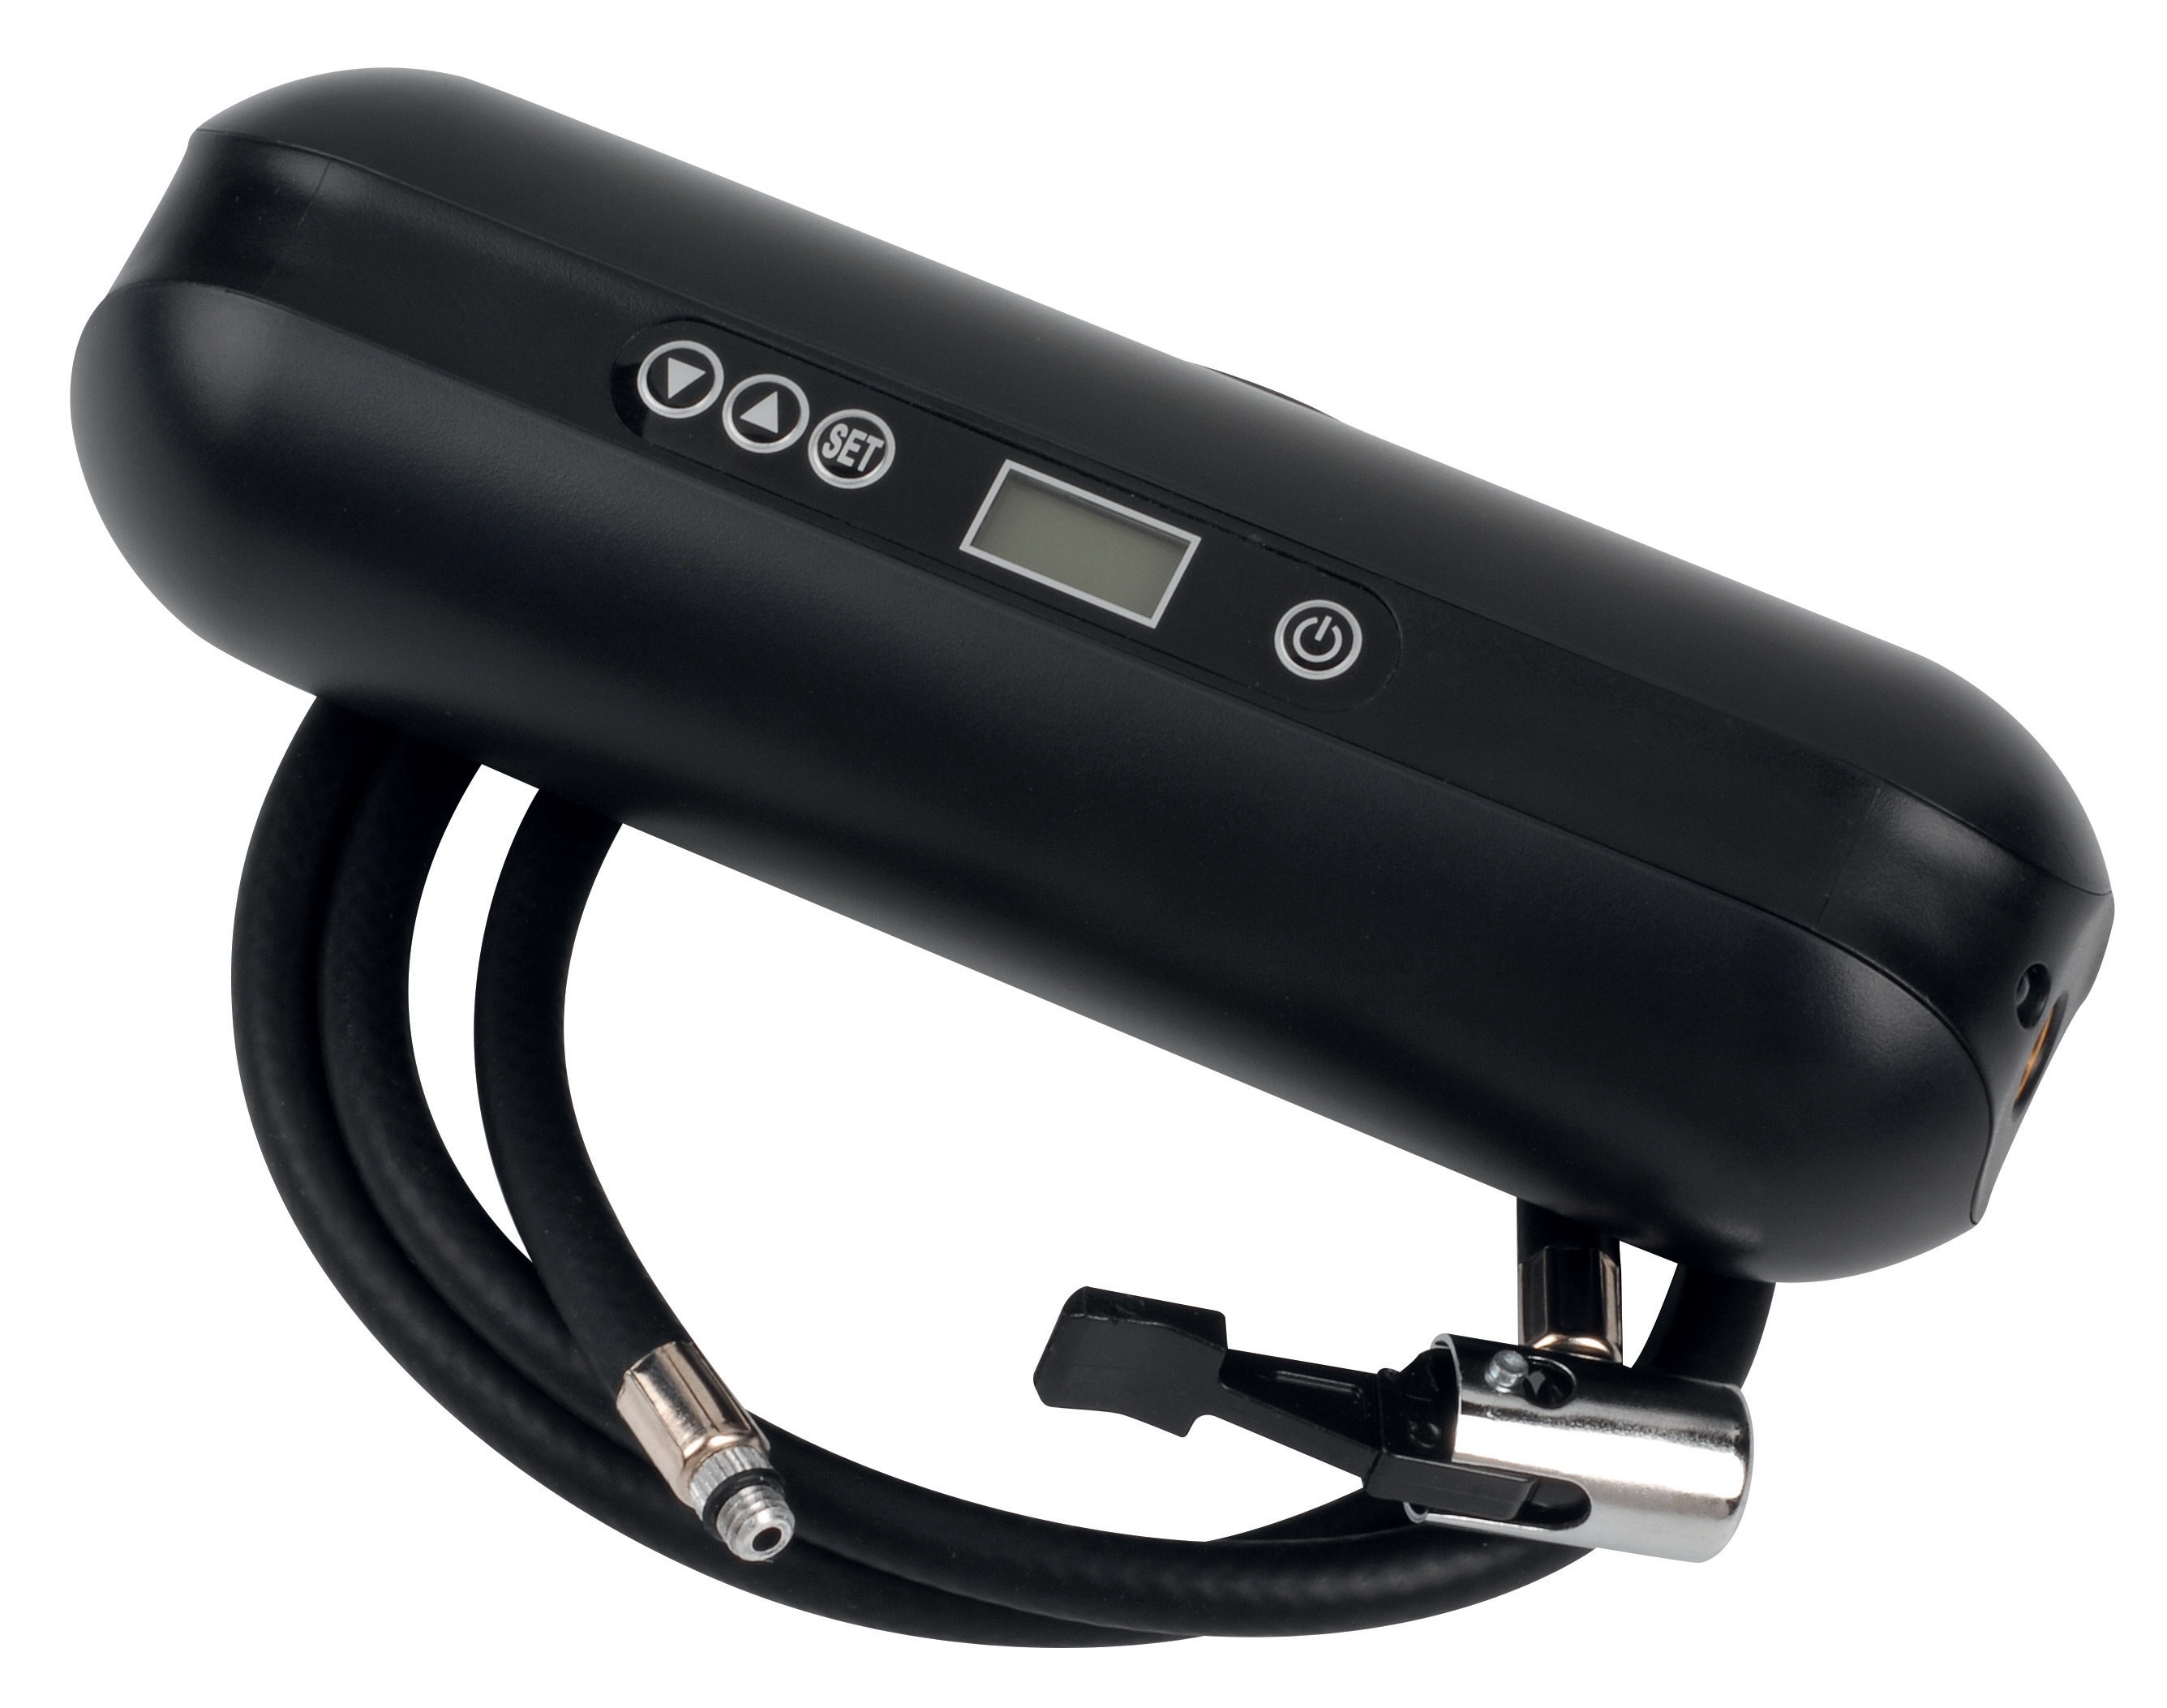
For pressurized systems requiring battery-powered field setup, the CBM expansion tank inflator with 2000 mAH battery operates across -20 to 60°C with support for multiple pressure units, enabling technicians to establish accurate baseline pressures during commissioning or after maintenance procedures. Its 10.3 bar maximum rating suits both HVAC and low-pressure industrial applications.
The key integration principle: select measurement instruments that provide data in compatible units and output formats. The Dwyer transmitters output 4-20 mA signals compatible with most building automation systems and data loggers, enabling continuous remote monitoring. The pressure gauges and probes provide manual reading capability when automated systems aren't yet deployed, allowing phased implementation that spreads capital investment.
Converting Measurement Data into Maintenance Action
The most sophisticated measurement system fails if maintenance teams lack a decision framework for interpreting results. Establish these decision rules:
- Green zone (0-80% of specification limit): Normal operation, continue routine maintenance schedule
- Yellow zone (80-95%): Increased monitoring frequency, schedule maintenance within 2-4 weeks
- Red zone (>95%): Plan immediate maintenance, prepare replacement parts, schedule technician urgently
Communicate these thresholds across maintenance teams, equipment operators, and facility management. A technician who understands that a 10°C temperature rise moves a system from green to yellow zone will prioritize investigation appropriately.
Conclusion
Measurement & Detection systems represent the translation layer between equipment condition and maintenance decision-making. By implementing multi-parameter monitoring with clear baseline establishment, systematic trend analysis, and actionable decision frameworks, maintenance teams transform reactive troubleshooting into predictive reliability engineering.
The investment in proper measurement equipment through established suppliers like 3G Electric—with access to quality instruments from Dwyer, Preciman, and CBM—pays dividends in extended equipment life, reduced emergency repairs, and improved operational reliability across Singapore's competitive industrial landscape.