
Understanding Measurement & Detection in Hydraulic and Pneumatic Systems
Measurement & Detection is the foundation of predictive maintenance for hydraulic and pneumatic equipment. Unlike visual inspections alone, systematic measurement tells you what's actually happening inside your systems—before visible damage occurs. For maintenance teams in Singapore's demanding industrial environment, this approach reduces unplanned downtime, extends asset life, and improves safety compliance.
With over 35 years of experience supplying industrial equipment, 3G Electric has seen how organisations that adopt structured measurement protocols consistently outperform those relying on reactive maintenance. The difference is simple: you can't fix what you can't measure.
Hydraulic and pneumatic systems operate under pressure, temperature, and flow conditions that demand precision. A 1-bar drift in pressure measurement might seem minor until a production line grinds to a halt. A temperature rise of 5°C could signal impending pump failure. Flow rate variations indicate seal degradation. Measurement & Detection tools give you the data to act before crisis strikes.
Section 1: Pressure Measurement for System Diagnostics
Why Pressure Monitoring Matters
Pressure is the primary indicator of system health in hydraulic and pneumatic circuits. Abnormal pressure patterns reveal blockages, leaks, valve drift, and pump wear. Your maintenance team needs reliable pressure data at multiple circuit points to diagnose root causes accurately.
Typical pressure measurement points include:
- Main system line (after pump)
- Individual circuit branches (actuator lines)
- Return lines (should be near zero or very low)
- Pilot pressure lines (control circuits)
- Relief valve outlets
Inconsistent readings across these points tell different stories. High pressure in return lines suggests blocked filters or stuck relief valves. Low pressure on a specific branch indicates a leak or clogged line. Pressure fluctuations point to pump cavitation or worn bearings.
Using Preciman Manometers for Field Diagnostics
The Preciman Manometer ABS vert D80 0/+16bar G1/2 is purpose-built for industrial hydraulic and pneumatic circuits. Here's how to use it effectively in your facility:
Installation Best Practices:
1. Ensure the system is at operating pressure before connecting the manometer
2. Use appropriate fittings and snubbers to avoid pressure spikes damaging the gauge
3. Position the manometer at eye level for accurate reading
4. Allow 2-3 minutes for pressure stabilisation before recording data
Reading and Recording:
The 80mm gauge diameter provides clear visibility even in poor lighting conditions common in Singapore's industrial settings. The ±2.5% accuracy means readings are precise enough to detect small drift patterns over time. Record pressure values at the same time each day to establish baseline trends.
Create a simple log sheet with columns for: Location, Expected Pressure, Actual Pressure, Time, Temperature, and Technician Name. This becomes invaluable when diagnosing intermittent issues.
Interpreting Results:
- Pressure higher than expected = blocked lines, clogged filters, or stuck valves
- Pressure lower than expected = leaks, worn pumps, or bled accumulators
- Fluctuating pressure = cavitation, aeration, or unstable pump output
- Gradual pressure drop over weeks = internal leakage in cylinders or valves
Temperature Correlation with Pressure
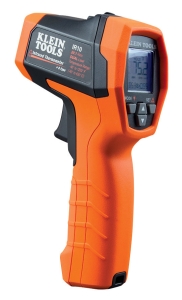
Pressure and temperature are linked. As temperature rises, fluid viscosity changes, affecting system performance. Use the CBM Infrared thermometer with type K input to simultaneously measure surface temperature on hydraulic components while recording pressure. A high-pressure reading combined with elevated temperature suggests:
- Excessive friction (worn bearings, tight seals)
- Fluid degradation
- Inefficient cooling
- System working beyond design capacity
Section 2: Flow Rate Measurement for Seal and Valve Assessment
Detecting Flow Anomalies
Flow rate tells you whether hydraulic fluid is reaching actuators efficiently. Declining flow at constant pressure indicates seal degradation or internal leakage. Erratic flow suggests valve malfunction or aeration in the system.
For maintenance teams, flow measurement answers critical questions:
- Is the pump delivering its rated output?
- Are individual circuits receiving proportional flow?
- Has cylinder performance degraded due to internal leakage?
- Is the directional control valve sticking or drifting?
Practical Flow Measurement with Dwyer Probes
The Dwyer Medium flow metal probe MAFS-20 is designed for industrial process monitoring and works well in hydraulic test circuits. The 71cm probe length allows measurement in confined spaces and hard-to-reach circuit points.
Setup Steps:
1. Isolate the circuit section you want to measure
2. Connect the probe to a test coupling at the circuit inlet
3. Run the system at normal operating pressure
4. Allow flow to stabilise (usually 30-60 seconds)
5. Record the flow reading and compare to system documentation
Field Troubleshooting Guide:
If flow is significantly lower than nameplate specifications:
- Check for blocked suction strainers (most common)
- Inspect inlet filters and replace if restriction is evident
- Verify pump shaft rotation direction (easy to miss after maintenance)
- Check for cavitation (white noise from pump indicates air in fluid)
- Test relief valve setting—it may be set too low
If flow drops gradually over weeks, suspect internal leakage in cylinders. Request a full system test before authorising seal replacement.
Section 3: Pressure Switch Integration for Automated Monitoring
Moving Beyond Manual Measurement
While field measurement with gauges and probes provides immediate insight, pressure switches and transmitters enable continuous monitoring and automated alarms. This is especially valuable in Singapore's 24/7 industrial operations where night-shift coverage may be limited.
Implementing Pressure Switches for Safety and Alerts
The Dwyer Pressure switch DXW-11-153-4 is designed for industrial fluid systems with adjustable setpoint and differential ranges. Here's how maintenance teams typically deploy these:
Installation Locations:
- Pump outlet (alarm if pressure exceeds safe limits)
- System return line (alert if backpressure rises unexpectedly)
- Accumulator circuits (detect low pre-charge or leakage)
- Individual branch circuits (identify which circuit is failing)
1. Set the main system alarm setpoint to 90% of relief valve setting
2. Set differential range to catch pressure drops of 0.5-1.0 bar (depending on system sensitivity)
3. Mount switches where operators can hear audible alarms
4. Wire to PLC or control system if available
5. Test weekly by slowly increasing pressure until switch triggers
The IP65 protection rating makes these switches suitable for humid Singapore environments and washdown areas. The 5A contact rating handles standard control circuit loads.
Upgrading to Continuous Pressure Transmitters
For advanced facilities, the Dwyer Transmitter 629-05-CH-P2-E5-S1 provides continuous 4-20 mA output for real-time pressure monitoring. The 0.5% accuracy captures subtle system drift that discrete switches would miss.
Advantages for Maintenance Teams:
- Trending data reveals developing problems weeks before failure
- Remote monitoring allows off-site diagnostics
- Integration with CMMS (Computerised Maintenance Management Systems) automates work order generation
- Historical data justifies equipment replacement budgets
- Operators see real-time pressure on HMI (Human Machine Interface) displays
1. Install transmitter in primary circuit branch (post-pump line)
2. Run 4-20 mA signal to PLC or data logger
3. Configure alarm thresholds at 85% and 110% of nominal pressure
4. Log data hourly via PLC to create daily trend files
5. Review trends weekly during maintenance meetings
Section 4: Creating Your Measurement & Detection Routine
Daily Operator Checks (5 minutes)
Train your operators to perform basic visual and audio inspection:
- Listen for unusual pump noise (cavitation, bearing wear)
- Feel for unexpected heat on hose/manifold surfaces
- Note any visible leaks or seepage
- Confirm pressure gauge readings are within normal range
This catches obvious problems before they cascade.
Weekly Maintenance Team Spot Checks (30 minutes)
Your maintenance technicians should conduct structured measurements:
1. Pressure Check: Connect the Preciman manometer at three circuit points, record values
2. Temperature Survey: Use the CBM infrared thermometer on pump, motor, manifold, and return line
3. Flow Verification: If time permits, measure flow at pump outlet using the Dwyer probe
4. Switch Test: Manually trigger pressure switches and confirm alarm function
5. Document: Record all values in your maintenance log and compare to previous week
This routine takes 30 minutes and prevents 90% of hydraulic failures.
Monthly Diagnostic Assessment (1-2 hours)
Once monthly, perform comprehensive system analysis:
- Measure pressure at all circuit branches simultaneously
- Cross-reference pressure with temperature readings
- Compare flow rates to design specifications
- Review transmitter trend data (if installed) for drift patterns
- Inspect hose and fitting condition visually
- Test all pressure switches and transmitters
- Plan corrective maintenance based on findings
Creating Baseline Data
New systems require baseline establishment. During commissioning:
1. Record pressure, flow, and temperature at design operating point
2. Repeat measurements after 8, 16, and 24 hours of operation
3. Document this baseline in permanent system file
4. Use baseline as comparison standard for all future measurements
5. Alert management if any parameter drifts >5% from baseline
Baseline data is your benchmark. Without it, you're flying blind.
Responding to Abnormal Measurements
If Pressure Exceeds Normal Range by >10%:
- Check relief valve setting with qualified technician
- Inspect inlet strainer for blockage
- Verify pump shaft rotation direction
- Test directional control valve for sticking spool
- Schedule full system diagnostic within 48 hours
- Change inlet and return filters immediately
- Bleed air from system if suspected
- Test pump for cavitation or internal wear
- Inspect cylinders for external leakage
- Plan pump rebuild or replacement if leakage confirmed
- Check cooler operation and fan function
- Inspect for blocked cooler airways
- Verify fluid level (low fluid overheats)
- Confirm pump displacement setting
- Test for internal leakage causing friction
Integrating Measurement & Detection with Your Maintenance Strategy
Measurement & Detection isn't a separate activity—it's the core of predictive maintenance. Every measurement informs your maintenance decisions.
3G Electric's 35+ years supplying industrial equipment has shown us that facilities using structured measurement protocols spend 40% less on emergency repairs. The cost of pressure gauges, flow probes, and temperature meters is recovered within months through prevented downtime.
Start simple: add the Preciman manometer to three key circuits this month. Next month, add temperature monitoring with the CBM infrared thermometer. By quarter-end, integrate the Dwyer pressure transmitter for continuous data. This phased approach builds capability without overwhelming your team.
Your maintenance team has the expertise to keep systems running. Give them the measurement tools to see what's happening before problems become expensive.