Introduction: Maintenance & Service Diagnostics in Real-World Operations
Maintenance & Service challenges intensify when your industrial equipment underperforms without obvious failure indicators. Pressure drops slowly. Flow rates diminish. Spray patterns become inconsistent. Rather than replacing components, experienced maintenance teams use structured diagnostic workflows to isolate problems, verify root causes, and execute targeted repairs.
With 35+ years of global equipment distribution, 3G Electric has supported thousands of maintenance operations facing these exact scenarios. This guide translates that experience into actionable troubleshooting protocols you can apply immediately—whether you're diagnosing high-pressure pump systems, pressure regulation failures, or spray nozzle performance issues.
Section 1: Diagnostic Workflow for High-Pressure Pump Systems
Understanding Pump Performance Baselines
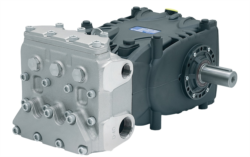
Before diagnosing pump problems, establish what "normal" looks like for your specific equipment. Industrial pumps like the Pratissoli KF30 (106 L/min at 200 bar, 40 kW) or Pratissoli MW40 (211 L/min at 210 bar, 85 kW) have documented performance curves. Maintenance teams must record baseline metrics during initial installation:
- Flow rate at rated pressure (measured in L/min)
- Operating temperature under load
- Noise signature during normal operation
- Pressure stability over 30-minute runs
- Power consumption (kW input)
Deviations from these baselines reveal specific failure modes. A 15% flow reduction with stable pressure suggests internal seal degradation. A pressure drop with normal flow indicates relief valve drift.
Step-by-Step Pump Diagnostics Protocol
Stage 1: Data Collection (15 minutes)
Gather real-time measurements from your operating system:
- Inlet pressure (should be atmospheric or slightly above)
- Outlet pressure at pump discharge
- Flow rate using your system's flow meter
- Motor amperage draw (compare to nameplate rating)
- Discharge temperature at outlet line
Compare collected data against documented specifications:
- If outlet pressure is 30+ bar below rated spec: relief valve or internal leakage
- If flow is 20%+ below spec at rated pressure: impeller wear or cavitation
- If motor amperage exceeds 110% nameplate: mechanical friction or fluid viscosity issue
- If discharge temperature rises 15°C above normal: increased internal friction
Suspected Relief Valve Drift:
- Manually crack the relief valve adjustment 1/4 turn counterclockwise
- Observe pressure response (should rise 5-10 bar immediately)
- Reclose valve slowly, recording the cracking pressure
- If pressure won't stabilize ±5 bar, relief valve requires service
- Check case drain line for blockage or excessive backpressure
- Verify case drain outlet is below minimum system pressure
- If case drain temperature is elevated (>50°C), internal seals are failing
- Verify inlet line is 1.5× pump inlet port diameter minimum
- Check inlet strainer pressure drop (should be <0.5 bar)
- Measure actual inlet pressure (minimum 0.3 bar absolute)
- If inlet pressure drops below 0 bar absolute, air enters—cavitation begins
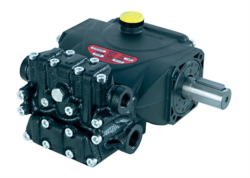
For compact gear pumps like the Interpump E1D1808 L (8 L/min at 180 bar), cavitation manifests as sudden efficiency loss and increased noise even at moderate pressures.
Maintenance & Service Action Plan
Once root cause is confirmed:
- Relief valve drift: Disassemble valve, inspect seating surfaces for scoring, clean with appropriate solvent, reinstall with fresh seals
- Internal leakage: Schedule pump rebuild with OEM or qualified service center; typical recovery: 4-8 hours labor
- Cavitation: Clear inlet blockages, verify fluid viscosity (correct viscosity prevents cavitation), reduce flow demand or increase inlet pressure
Section 2: Pressure Regulation & Safety System Troubleshooting
The Critical Role of Regulators in System Stability
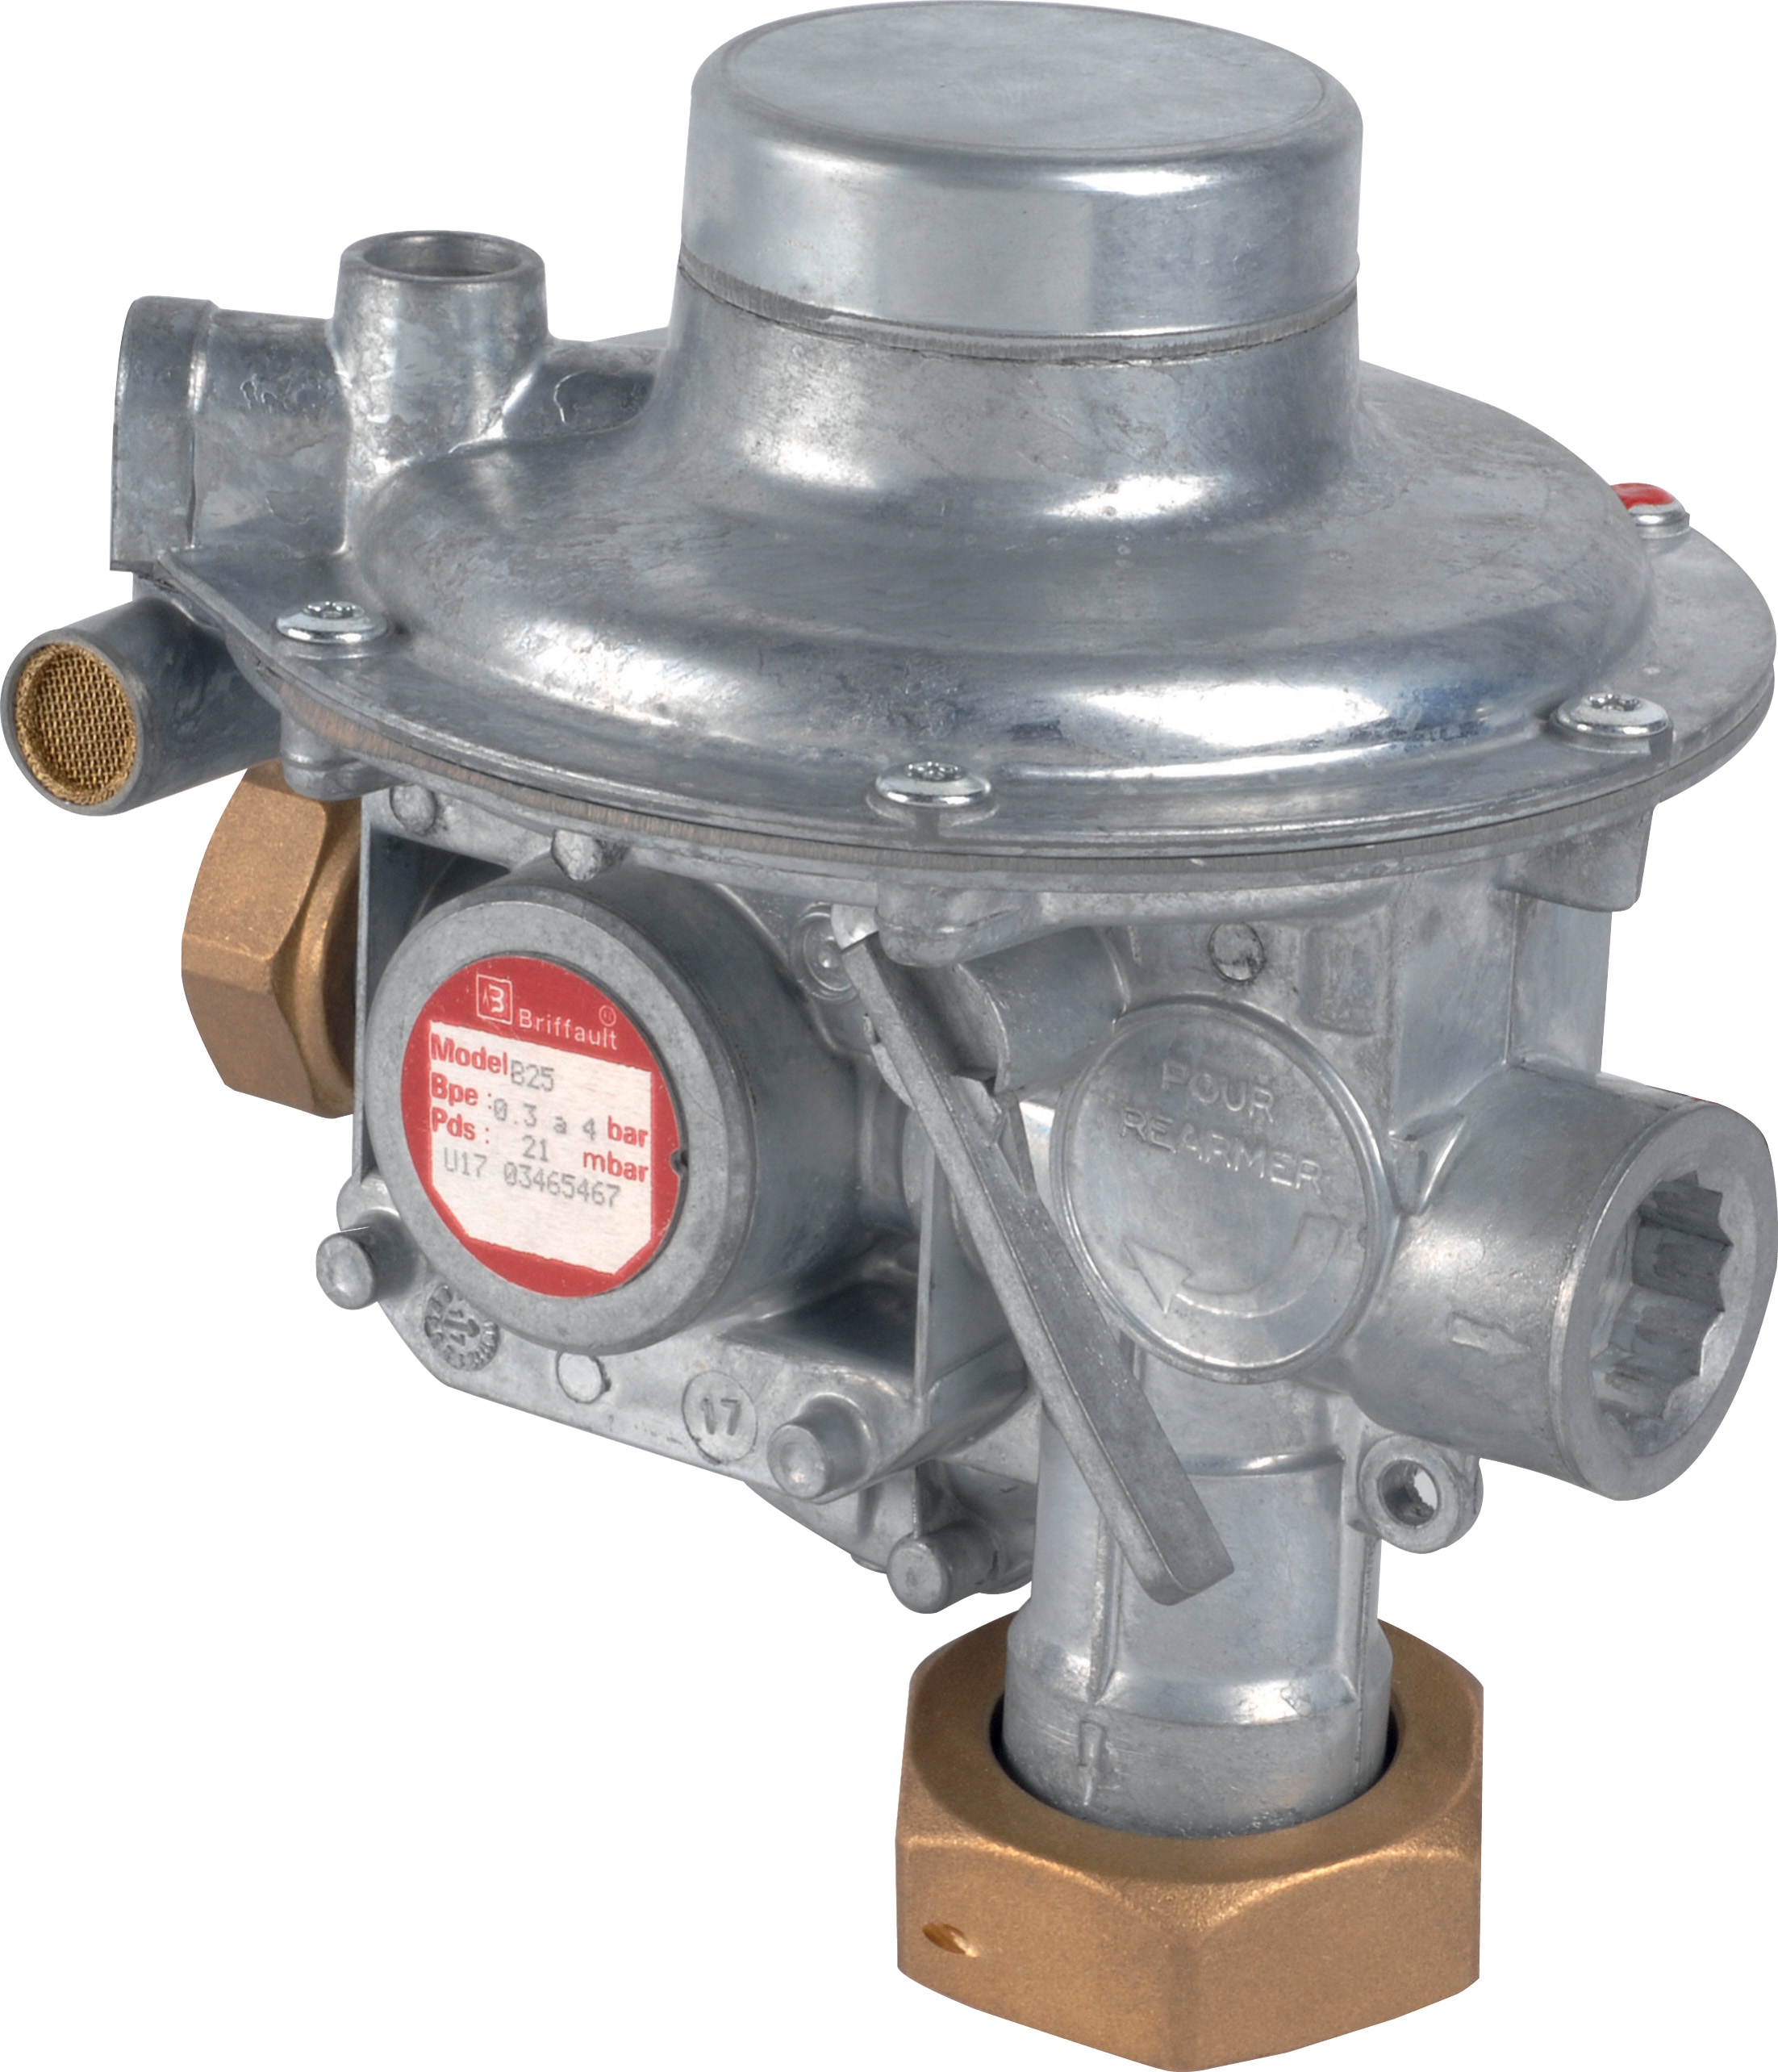
Pressure regulators maintain stable outlet pressure across varying inlet conditions and flow demands. The Francel B25/37mb precision regulator delivers consistent 37 mbar outlet pressure with integrated safety relief—critical for laboratory and industrial gas distribution where pressure fluctuations cause process failures.
When regulator performance drifts, most maintenance teams assume the unit failed completely. Systematic diagnosis often identifies fixable issues: vent blockage, pilot line contamination, or simple seal degradation.
Three-Tier Regulator Diagnostic Sequence
Tier 1: External Inspection (5 minutes)
- Observe outlet pressure gauge reading—does it match set pressure?
- Check all vent ports for blockage or visible contamination
- Inspect inlet and outlet ports for corrosion or weeping
- Verify pilot line connection (if equipped) is secure and clear
- Listen for abnormal hissing (indicates seat leakage or excessive relief flow)
- Isolate the regulator by closing inlet block valve
- Slowly open inlet; observe gauge response—should rise smoothly to set point
- Connect flow load (gradually increase demand); outlet pressure should remain stable ±2%
- Remove flow load; outlet pressure should hold steady (no creep)
- Shut inlet block valve; outlet pressure should drop slowly (normal case drain)
This test reveals internal seal conditions:
- Close inlet block valve with regulator pressurized to 80% of set point
- Close outlet block valve, trapping gas in regulator outlet
- Record outlet gauge reading at 0-minute mark
- Record gauge reading after 10 minutes of isolation
- Expected decay: <2% pressure loss (excellent); 3-5% (acceptable); >8% (internal seal failure)
Maintenance & Service Interventions by Diagnosis
Vent Port Blockage:
- Locate vent port (typically 10 mm NPT connection on regulator body)
- Carefully inject low-pressure compressed air (2 bar max) through vent port
- If blockage persists, remove regulator from service for disassembly cleaning
- Replace vent filter element if equipped
- Close inlet block valve, depressurize regulator completely
- Disconnect pilot line at both ends
- Blow through line with dry compressed air—should pass freely
- If blockage detected, flush with approved cleaning solvent
- Replace pilot line if damage is visible
- Perform regulator replacement if decay test exceeds 8%
- Before removal, photograph all connections and settings
- Order replacement unit matching inlet/outlet port sizes and pressure rating
- Upon installation, verify all external connections before pressurizing
Section 3: Spray Equipment Performance Recovery and Nozzle Diagnostics
Why Spray Pattern Quality Matters to Production
Industrial spray systems using equipment like the Euspray flat jet nozzle (1/4" BSPT, 25° angle, index 30) directly impact coating uniformity, cleaning efficiency, and chemical application accuracy. Pattern degradation happens gradually—initially unnoticed, then catastrophic as coverage gaps expand.
Maintenance teams often replace nozzles prematurely. Diagnosis first; replacement second.
Spray Pattern Diagnostic Framework
Visual Inspection Protocol (10 minutes)
- Activate spray system at normal operating pressure
- Direct spray into clean white container at standardized distance (typically 30 cm)
- Observe full spray pattern for 30 seconds
- Record observations: pattern shape (should match design spec), symmetry, edge definition, any streaking or droplet separation
- Narrow center stream with dispersed edges: Nozzle orifice partially blocked; internal debris
- Asymmetrical pattern (spray favors one side): Orifice erosion on one side; upstream piping misalignment
- Spotty or pulsing spray: Supply pressure fluctuation; pump cavitation upstream; regulator instability
- Low flow with correct pattern: Nozzle correctly sized but system pressure below rated spec
- Pattern fan-off (no clear geometry): Pressure excessive (if adjustable); orifice severely eroded
Use digital pressure gauge at spray head manifold:
- Record pressure reading every 10 seconds for 5 minutes
- Calculate pressure range (max - min)
- Acceptable stability: ±3 bar maximum variation
- If variation exceeds ±5 bar, address pump/regulator/supply line issues before nozzle replacement
With nozzle positioned safely:
- Collect spray discharge into calibrated container for 30 seconds
- Calculate flow: (collected volume in mL ÷ 30 seconds) × 2 = L/min
- Compare to nozzle specification (typically printed on body or in documentation)
- Tolerance: ±10% of rated flow at rated pressure
- If measured flow is 20%+ below spec: nozzle orifice blockage
Maintenance & Service Nozzle Recovery Steps
For Partial Blockage (5-15% flow loss):
1. Safely isolate nozzle from pressurized supply
2. Remove nozzle from holder (usually 1/4" or 1/2" connection)
3. Inspect orifice opening with 10× magnification—visible debris?
4. If debris visible, carefully insert soft brass wire (smaller than orifice) to dislodge
5. Flush nozzle with clean solvent aligned with orifice direction (not perpendicular)
6. Air-dry completely before reinstallation
7. Test spray pattern immediately after reinstallation
For Erosion or Severe Blockage (>20% flow loss):
1. Order replacement nozzle matching original specification (connection size, spray angle, flow rating)
2. Document which nozzle position this replaces (maintain spray pattern consistency across system)
3. Install replacement nozzle, verify tightness without over-torque (hand-tight + 1/4 turn maximum)
4. Run system at 50% pressure for 1 minute to verify no leaks
5. Increase to operating pressure; verify pattern matches installed nozzles
6. Set failed nozzle aside for analysis if pattern deviation persists
System-Level Prevention:
- Install 100-micron spin-on filters upstream of spray manifold
- Check filters monthly; replace when differential pressure exceeds 1 bar
- Verify system pressure regulator is set ±3 bar of nozzle rated pressure
- Record baseline spray pattern photographs monthly for comparison
Section 4: Implementing Systematic Maintenance & Service Records for Continuous Improvement
Why Documentation Transforms Troubleshooting Into Predictive Maintenance
Maintenance teams responding to immediate failures operate in crisis mode. Teams with systematic records detect performance trends months before equipment breaks down. The difference: documented baseline data.
3G Electric's 35+ years supporting global maintenance operations reveal a consistent pattern: facilities with systematic equipment records solve 70% of problems through diagnosis rather than replacement; facilities without records replace 3× more components annually at 5× higher cost.
Minimum Documentation Requirements
For each critical equipment item (pumps, regulators, nozzle arrays), maintain a standardized record:
Installation Record (completed once):
- Equipment SKU and serial number
- Installation date and location
- Operating pressure and flow rating
- Initial baseline measurements (pressure, flow, temperature, noise)
- Connected upstream/downstream equipment
- Operating pressure at load
- Flow rate (if measurable)
- Discharge temperature
- Any performance changes observed
- Any maintenance actions taken
- Full performance comparison to baseline
- Pressure stability test results
- Visual inspection for leaks, corrosion, or damage
- Relief valve cracking pressure (if applicable)
- Case drain condition (cleanliness, temperature)
Building Your Diagnostic Decision Tree
With 3-6 months of documented data, patterns emerge:
- Pressure creep: +1-2 bar/month indicates gradual relief valve drift (predictable, serviceable)
- Temperature rise: +3-5°C/month indicates internal friction increase (schedule rebuild before failure)
- Flow decline: linear 2-3% monthly decline indicates internal seal wear (plan replacement within 6 months)
- Pressure instability: increasing variance month-to-month indicates pump cavitation risk (address inlet immediately)
These patterns allow you to schedule maintenance before production impact—not after emergency failure.
Selecting Equipment for Your Service Program
When establishing Maintenance & Service documentation, prioritize:
1. Flow-critical equipment (high-pressure pumps like KF30 or MW40): Monthly diagnostics mandatory
2. Pressure-sensitive equipment (precision regulators like Francel B25/37mb): Quarterly detailed testing
3. Application-critical equipment (spray systems with multiple nozzles like Euspray flat jets): Monthly pattern documentation
4. Compact, high-wear components (compact gear pumps like Interpump E1D1808 L): Quarterly performance assessment
Conclusion: From Reactive Response to Predictive Service Excellence
Maintenance & Service excellence transforms when teams shift from reactive replacement to systematic diagnostics. The workflows in this guide—pump performance analysis, pressure regulator testing, spray pattern verification, and systematic documentation—work across all equipment types and global operating conditions.
3G Electric's role as a global equipment distributor for 35+ years has positioned us to observe how the most reliable industrial operations maintain their advantage: they diagnose methodically before acting. They document systematically to predict failures. They build institutional knowledge from each service event.
Your maintenance team has the expertise to implement these diagnostic workflows immediately. Start with your highest-impact equipment. Run one complete diagnostic cycle. Document results. Compare against baseline. From month two, patterns emerge. From month six, you'll predict equipment needs rather than react to failures.
That's when Maintenance & Service shifts from cost center to competitive advantage.