Understanding the True Cost of Poor System Integration
Most plant managers evaluate Pumps & Compressors based on individual unit specifications: pressure ratings, flow rates, and motor power. This narrow approach overlooks the reality that 60% of pump and compressor failures occur at system integration points—not within the equipment itself.
When a hydraulic pump operates isolated on a test bench, it performs flawlessly. Install it into a real plant system with mismatched piping, incompatible relief valves, and poorly configured feedback loops, and premature wear accelerates dramatically. The issue isn't the pump; it's the system.
With 35+ years of experience distributing industrial equipment across Southeast Asia, 3G Electric has observed this pattern repeatedly: plant managers invest in premium equipment but lose those savings within 18 months due to integration failures. Your facility in Singapore operates in a humid, demanding environment with 24/7 production schedules. System integration discipline directly impacts your margin.
Critical Interface Points: Where Integration Fails
Pressure Cascade Misalignment
Your facility likely runs multiple subsystems—hydraulic presses, cooling circuits, and pressurized fluid transfer operations—potentially drawing from the same pump source. When these systems aren't pressure-matched, catastrophic interactions occur.
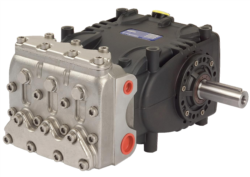
Consider this real scenario: A plant installed a Pratissoli PUMP SN7061 L rated for 150 bar continuous operation. On paper, perfect specifications for their 140 bar hydraulic press. However, the relief valve upstream was set to 160 bar, and the return line incorporated a backpressure valve sized for different flow conditions. Result: the pump cycled continuously between 145–165 bar, creating harmonic oscillations that damaged internal swashplate bearings within 8 months.
The solution required mapping your entire system's pressure profile:
- Primary system pressure: Your main load requirement (e.g., 150 bar for hydraulic work)
- Relief valve setting: Must account for pressure spikes during load shedding (typically +5% margin)
- Backpressure valve settings: Sized for actual return line flow, not theoretical flow
- Accumulator pre-charge: Must be 10% below minimum system pressure to function correctly
- Pilot line configurations: Secondary systems drawing pilot pressure need dedicated regulation
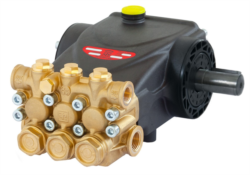
For high-flow applications like yours, the Interpump PUMP E2B2014 L FL.B3B14 delivers 14 L/min at 200 bar—excellent specifications, but only if your system's backpressure and relief architecture actually supports that rating. Mismatched relief valves will cause continuous cycling or relief venting, wasting energy and generating heat that degrades hydraulic fluid.
Motor Speed Synchronization and Load Matching
Pump performance is inseparable from motor speed. Yet plant managers frequently install variable-frequency drives (VFDs) or operate motors at part-load without understanding how these conditions interact with pump displacement.
The Interpump PUMP W916 R U.S. W/O RAILS operates at 1750 rpm delivering 18 L/min at 160 bar. This specification assumes full motor speed and load. If your facility introduces VFD control to reduce energy during low-demand periods, you're not simply reducing flow proportionally. You're entering unstable pump operating regions where:
- Swashplate pumps can't maintain displacement control below 40% speed
- Gear pumps experience cavitation at reduced speeds in high-pressure circuits
- Bearing loads shift, accelerating wear in unexpected areas
- Thermal control becomes marginal—the pump generates proportionally more heat at reduced displacement
Your integration strategy must define operating envelopes for each system state. Document minimum and maximum speeds for each pump, cross-reference against your production cycle, and validate through flow/pressure trending over the first 100 operating hours.
Thermal Coupling and Heat Rejection Design
Pumps and compressors generate heat proportional to pressure drop and flow rate. In Singapore's climate, ambient temperatures routinely exceed 32°C with 80%+ humidity. Many plant managers install equipment and overlook cooling infrastructure entirely.
The Interpump PUMP W953 R VALVE W/O RAILS, rated for 11.5 L/min at 172 bar, generates approximately 3–4 kW of waste heat under continuous operation. A 1,450 rpm system running this pump in a poorly ventilated mechanical room could accumulate 15–20°C temperature rise within 2 hours. Hydraulic fluid viscosity drops, internal clearances increase, and pump efficiency collapses.
Your integration plan must specify:
- Cooler sizing based on calculated heat load (not manufacturer estimates)
- Cooler placement to prevent short-circuiting heated return fluid back to intake
- Return line configuration ensuring backpressure doesn't exceed cooler nameplate rating
- Thermostatic valve logic to maintain fluid temperature within ±5°C during operation
- Ambient design temperature (use 35°C for Singapore, not standard 20°C)
Validation Protocol: Testing System Integration Before Full Commissioning
Phase 1: Static System Mapping (Pre-Startup)
Before energizing any equipment, create a detailed schematic documenting:
- Every pressure measurement point and valve setting
- All relief and pilot lines with actual orifice sizes
- Return line routing, showing elevation changes and cooler connections
- Accumulator location, size, and pre-charge pressure
- Fluid type and viscosity grade (critical for temperature compensation)
For systems incorporating the Delta Pump VM3 RL 2.4, verify the solenoid valve timing logic against your process control sequence. Fuel pump units require synchronized electrical signaling; integration failures here create pressure spikes that propagate through the system.
Phase 2: Progressive Load Commissioning (First 40 Operating Hours)
Don't run your system at full capacity immediately. Instead:
1. Low-load run-in (0–8 hours): Operate at 25% demand, monitor pressure/temperature every 15 minutes, document baseline readings
2. Medium-load operation (8–24 hours): Increase to 50% demand, verify system stabilizes at target temperature and pressure
3. Full-capacity operation (24–40 hours): Run at design load, record pressure and temperature profiles every 30 minutes
During this phase, establish trending data that becomes your baseline for predictive maintenance. If pressure oscillates ±8 bar or temperature varies >3°C between similar cycles, your integration has unresolved issues that will compound over time.
Phase 3: Documented Performance Envelope
Generate a system operating manual specific to your facility documenting:
- Normal operating window: Pressure range ±3%, temperature range ±2°C
- Alarm thresholds: Pressure >5% deviation, temperature >5°C above baseline
- Load shedding procedure: How the system must depressurize safely
- Emergency shutdown sequence: Pump isolation, accumulator bleed-down, cooler bypass
This document becomes your maintenance team's control reference, eliminating guesswork about "normal" behavior.
Practical Monitoring: Early Detection of Integration Failures
Most plant managers implement monitoring only after failures occur. Proactive monitoring catches integration problems in early stages:
Pressure Trend Analysis
Record system pressure daily at the same operating point (e.g., "5-minute idle hold at full displacement"). Plot these readings on a simple trend line. A gradual 3–5 bar increase over 30 days signals internal pump wear or relief valve drift. Sudden 8+ bar spikes indicate cavitation, inadequate cooler capacity, or relief valve stiction.
Temperature Profiling
Measure return fluid temperature at system startup and again after 30 minutes of operation. Temperature rise should stabilize within this window. If it continues climbing after 30 minutes, your cooler is undersized or improperly plumbed. If temperature drops abnormally, you have cooler thermostat malfunction.
Motor Current Analysis
If your pump motor includes current monitoring (or you can retrofit a clamp meter), document baseline current draw at full load. If current increases 8–10% without load change, internal pump slippage is increasing—an integration failure point where wear accelerates.
Selecting Integrated Equipment: Matching Specification to System Reality
When you're ready to specify new equipment through 3G Electric's 35+ years of distribution experience, evaluate pumps within system context:
For precision hydraulic work requiring stable 140–150 bar operation, the Pratissoli PUMP SN7061 L at 61 L/min is an excellent choice—but only if your relief valve is precision-calibrated to ±2 bar tolerance. A typical industrial relief valve ±5% tolerance nullifies the pump's precision.
For compact systems with space constraints and variable demand, the Interpump PUMP E2B2014 L FL.B3B14 at 14 L/min and 200 bar is appropriately sized—provided your pilot system and load characteristics match that 200 bar design point. Using a 200 bar pump in a 120 bar system means permanent relief venting and wasted energy.
For legacy systems requiring fuel pump reliability, the Delta Pump VM3 RL 2.4 with integrated solenoid valve eliminates external pilot complexity—but integration success requires your control system to understand its 3500 rpm cycling behavior and pressure transient characteristics.
The common thread: specification matching isn't about matching nameplates. It's about verifying your facility's entire system architecture can absorb the equipment's actual operating characteristics.
Integration Checklist for Your Next Equipment Installation
- [ ] System pressure profile documented for all subsystems (primary, pilot, drain)
- [ ] Relief valve specifications verified against relief valve actual response curves (not just stated settings)
- [ ] Cooler sized for actual worst-case heat load (pressure drop × flow at maximum system demand)
- [ ] Motor speed range defined and VFD programming validated for safe pump operation
- [ ] Return line backpressure measured at all operating points; confirm <10% of relief setting
- [ ] Thermal run-in completed (40+ hours) with daily pressure/temperature trending
- [ ] System operating manual documented with normal envelope and alarm thresholds
- [ ] Maintenance team trained on baseline values and trend interpretation
- [ ] Quarterly pressure/temperature audits scheduled to track long-term drift
Summary: Integration as Competitive Advantage
Your competitors probably specify pumps the same way: match the pressure, match the flow, install and run. When their equipment fails at 18 months, they blame the manufacturer. When your integrated systems run reliably for 5+ years, you've gained a productivity advantage that compounds every quarter.
The difference isn't equipment quality. It's discipline around integration fundamentals: understanding how your system's pressure cascade, thermal management, and motor characteristics interact with pump behavior. It's validating those interactions through commissioning rigor. It's monitoring baseline behavior to detect drift before failure occurs.
3G Electric supports this integration discipline with 35+ years of regional experience. When you're ready to specify pumps or compressors for your next expansion, we bring facility-specific integration expertise to the table—not just product distribution. Your system's success depends on integration decisions made before equipment arrives.