Understanding Capacity Loss in Industrial Pumps & Compressors
Capacity degradation is one of the most insidious problems affecting industrial Pumps & Compressors in Singapore operations. Unlike catastrophic failures that force immediate shutdown, capacity loss develops gradually—your system appears functional while delivering 70–80% of rated output. Plant managers often attribute this to "normal aging," but systematic investigation typically reveals correctable root causes.
3G Electric's 35+ years distributing industrial equipment across Southeast Asia shows that capacity loss accounts for 40% of service calls that don't involve equipment failure. Understanding the distinction between true mechanical wear and reversible degradation can save your facility thousands in unnecessary replacement costs.
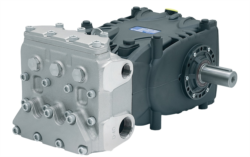
Capacity refers to two critical parameters: flow rate (volume per unit time) and pressure (force per unit area). High-pressure systems like the Interpump PUMP W2035 L ATEX delivering 35 L/min at 200 bar are particularly sensitive to small percentage losses—a 10% flow reduction in hazardous environments means 3.5 L/min lost to your production process.
Systematic Diagnostics: Identifying Capacity Loss Origins
Step 1: Baseline Measurement and Historical Comparison
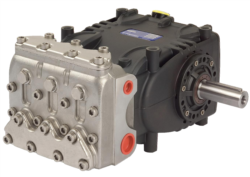
Begin diagnostics by establishing current performance against design specifications. For systems like the Pratissoli KF30 rated at 106 L/min and 200 bar, measure actual output using calibrated flow meters and pressure gauges at three critical points:
- Pump discharge (immediately after the pump outlet)
- System inlet (at the point of use)
- Return line (to detect internal leakage)
Compare measurements against commissioning records or original nameplate specifications. Document environmental conditions: ambient temperature (critical in Singapore's 28–35°C climate), fluid temperature, and inlet suction conditions. A 5°C increase in system fluid temperature typically reduces viscosity by 8–12%, which directly affects volumetric efficiency in gear and vane pumps.
If historical data is unavailable, interview long-serving technicians about performance trends. Questions to ask: "When did output begin dropping?" "Was it sudden or gradual?" "Did it correlate with any maintenance work or operational changes?" Sudden loss suggests blockage or seal failure; gradual loss indicates internal wear.
Step 2: Filtration and Fluid Contamination Assessment
Fluid contamination is responsible for 65% of capacity loss in systems operating beyond their first maintenance interval. Contaminated hydraulic fluid damages precision clearances in pumps, reducing volumetric efficiency from 95% to 60% within weeks.
Immediate inspection steps:
- Extract fluid samples from the system reservoir using sterile sampling bottles
- Conduct ISO cleanliness testing (ISO 4406 standard: report three particle counts at 4µm, 6µm, and 14µm)
- Perform visual inspection: dark discoloration indicates oxidation; cloudiness suggests water contamination
- Check filter bypass indicators—a lit indicator means the filter is saturated and fluid is bypassing filtration
Systems in tropical Singapore are vulnerable to water ingress through breather vents, particularly during monsoon seasons. Water reduces bulk modulus (fluid incompressibility), causing spongy pressure response and apparent flow loss. The Pratissoli SN7045 L pump operating at 210 bar with 45 L/min capacity will show measurable capacity reduction with as little as 2–3% water content in the hydraulic fluid.
If contamination is identified, schedule immediate flush-and-fill procedures using mobile filtration carts rated to ISO 16/14/11 or better. Do not attempt to restore capacity without addressing fluid quality first.
Step 3: Internal Leakage Quantification
Internal leakage—fluid bypassing from high-pressure discharge back to low-pressure return through worn clearances—is the primary cause of capacity loss in aging pumps. A 10% loss in flow output often reflects 15–20% internal leakage when accounting for volumetric efficiency degradation.
Field testing method (requires two technicians):
1. Isolate the pump from the system using isolation valves
2. Connect the pump discharge to a calibrated collection vessel with drain back to reservoir
3. Operate the pump at rated speed for exactly 5 minutes
4. Measure total volume collected versus expected output
5. Calculate actual efficiency: (Measured Volume ÷ (Rated L/min × 5)) × 100
For a system like the Interpump WW90 L WITH VALVE rated at 8 L/min at 2800 rpm, you should collect approximately 40 liters in 5 minutes. Collection of only 32–36 liters indicates internal leakage and worn pump internals.
Internal leakage cannot be corrected through maintenance—it requires pump replacement. However, quantifying the loss helps justify capital expenditure to senior management by demonstrating the production impact.
Pressure Delivery Failures and Degradation Mechanisms
Capacity loss appears differently depending on whether your system is flow-limited or pressure-limited. Understanding this distinction prevents misdiagnosis.
Pressure-Limited Systems (Load-Sensing or Compensator Circuits)
In pressure-regulated systems, the pump reduces displacement to maintain a setpoint pressure. If your system cannot achieve setpoint, the pump automatically strokes to maximum displacement, attempting to build pressure—but capacity appears normal while actual work output falls.
Root causes of pressure loss:
- Valve spool stiction in directional control valves: spool friction prevents smooth operation, creating pressure drops of 10–25 bar
- Contaminated or degraded valve spools from fluid oxidation
- Worn internal pump components reducing pressure-generation capability
- External line restrictions (kinked hoses, partially blocked filters)
Measure pump displacement (stroke volume per revolution) using a positive displacement meter. For Pratissoli KF30 pumps, displacement should be consistent across the rated speed range. If displacement varies with load, the pump control system (compensator or load-sensing mechanism) is degrading.
Flow-Limited Systems (Fixed Displacement)
Fixed displacement pumps deliver consistent flow regardless of load—until internal wear reduces volumetric efficiency. Capacity loss is immediately visible as reduced flow at the use point.
Progressive degradation pattern:
- Phase 1 (0–3% loss): Undetectable without instruments; fluid contamination begins
- Phase 2 (3–10% loss): Noticeable slowdown in actuator speeds; cycle times increase
- Phase 3 (10–20% loss): Production efficiency measurably impacted; customer complaints begin
- Phase 4 (>20% loss): System inability to complete duty cycle; urgent replacement required
Intervention in Phase 2 (before 10% loss) through fluid replacement and pump servicing can often restore 50–70% of lost capacity. Waiting until Phase 3 or 4 typically requires complete pump replacement.
Recovery Strategies and Maintenance Interventions
Non-Destructive Recovery Options
Fluid Management Program
If contamination is the primary cause, fluid replacement alone recovers 40–60% of lost capacity within 48 hours:
1. Drain reservoir completely and inspect internal surfaces for sludge accumulation
2. Replace all suction and return filters
3. Flush all system lines using mobile filtration carts (minimum ISO 16/14/11 cleanliness)
4. Refill with premium-grade hydraulic fluid matched to pump specifications
5. Operate system at low pressure for 30 minutes to circulate new fluid
6. Re-measure capacity and compare to pre-flush baseline
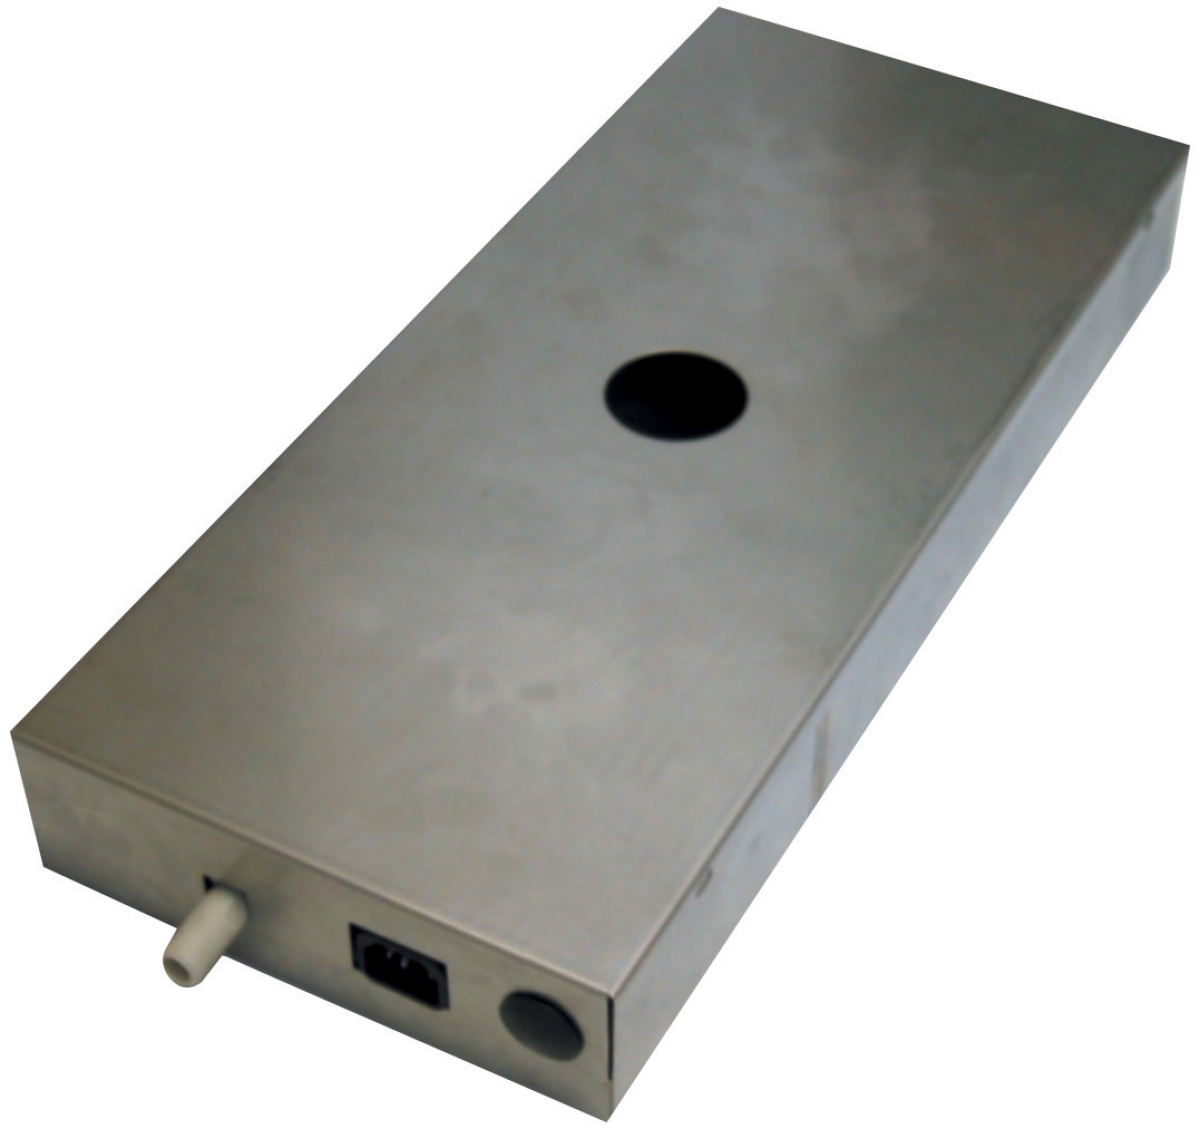
For HVAC condensate systems like the Clima Concept Display pump 5 liters, capacity loss often results from algae growth and mineral deposits in the 5-liter reservoir. Drain, clean with diluted citric acid, rinse thoroughly, and refill. This typically restores the 110 L/hr flow rate to specification.
Pump Servicing (Disassembly and Component Replacement)
If internal leakage is diagnosed but the pump is within economic service life:
1. Remove pump from service and document serial numbers and nameplate data
2. Disassemble to access wear surfaces: barrel, pistons, valve spool
3. Measure clearances with precision gauges (micrometers accurate to 0.01 mm)
4. Replace worn pistons and bushings with OEM service kits
5. Reassemble using calibrated torque specifications from manufacturer manuals
6. Pressure-test to rated pressure before reinstallation
Servicing typically costs 35–50% of new pump price and restores volumetric efficiency to 85–90% of new condition. For high-pressure applications like the Interpump PUMP W2035 L ATEX, servicing is often economically justified in the first 10 years of operation.
When Replacement is Required
Replace the pump if:
- Measured capacity loss exceeds 30% and cannot be attributed to contamination
- Pressure-testing reveals internal leakage rates >25% of theoretical displacement
- Pump age exceeds manufacturer service life recommendation (typically 8–10 years for continuous duty)
- Repair costs exceed 50% of new pump price
- Downtime for servicing creates unacceptable production loss
When specifying replacement equipment, reference your capacity loss data to select appropriately-sized equipment. Oversizing pumps by 20–30% (a common mistake) increases energy consumption and shortens component life.
Preventive Maintenance to Minimize Future Capacity Loss
Establish quarterly capacity monitoring as part of your preventive maintenance schedule:
Quarterly Inspections:
- Measure and document flow, pressure, and temperature at fixed points
- Test hydraulic fluid cleanliness (ISO 4406 samples)
- Inspect pump for external leakage, noise changes, or vibration increases
- Review energy consumption data; 10% capacity loss typically correlates to 8–12% power increase
- Replace suction and return filters regardless of visual appearance
- Drain and inspect reservoir for sludge; clean if necessary
- Pressure-test system relief valves to verify setpoint accuracy
- Conduct full capacity testing using the baseline measurement method described above
- Trend data across years to calculate degradation rate
- Model replacement ROI based on capacity loss trajectory
- Update preventive maintenance intervals if degradation accelerates
Systems maintained on this schedule typically preserve 90–95% of original capacity for 8–10 years, maximizing equipment service life and minimizing unplanned downtime.
Conclusion: Taking Action on Capacity Loss
Capacity loss in Pumps & Compressors is measurable, diagnosable, and often reversible through systematic methodology. Plant managers who implement baseline testing, fluid management programs, and preventive monitoring can extend equipment life while maintaining production efficiency. When replacement becomes necessary, documented capacity loss data supports capital equipment requests and ensures right-sized replacement specifications.
3G Electric's technical team is available to support capacity diagnostics in Singapore industrial facilities. Contact our engineering support line for assistance with baseline testing protocols or equipment specification review.