
Understanding Measurement & Detection for Trending and Diagnostics
Measurement & Detection goes far beyond single-point readings. For plant managers overseeing complex industrial operations in Singapore's demanding manufacturing and facilities environment, trending—the systematic collection and analysis of measurement data over time—is the foundation of predictive diagnostics. Rather than responding to failures, trending allows you to identify patterns that signal equipment stress, efficiency loss, or impending breakdown.
With over 35 years of experience supplying industrial equipment to Singapore facilities, 3G Electric has observed that plants implementing structured trending programs reduce unexpected downtime by 30–40% while extending equipment life by 15–25%. Trending works because most equipment failures don't occur suddenly; they announce themselves through gradual changes in pressure, temperature, and flow characteristics. By detecting these trends early, you shift from crisis management to informed planning.
Section 1: Core Trending Parameters for Industrial Systems
Pressure Monitoring as a Diagnostic Tool
Pressure is perhaps the most revealing parameter in hydraulic and pneumatic systems. Rising pressure under constant load, fluctuating pressures during normal operation, or slow pressure decay all signal different problems—seal degradation, valve drift, internal leaks, or pump wear.
The Preciman Manometer ABS vert D80 0/+16bar G1/2 provides accurate glycerin-filled measurement (±2.5% accuracy) ideal for establishing baseline pressure profiles in your systems. Manometers are mechanical reference instruments that don't require calibration or power, making them essential for validating digital sensor readings and confirming trends before investing in repairs.
For continuous digital trending, the Dwyer Transmitter 629-05-CH-P2-E5-S1 delivers 4-20 mA output with 0.5% accuracy across 0-100 psid, enabling real-time data logging into your plant management systems. This transmitter's IP65 rating handles Singapore's humid conditions without signal drift, critical for maintaining data integrity over weeks of trending.
Temperature as a Leading Indicator
Temperature rise often precedes pressure changes, making it a leading diagnostic indicator. Bearing temperature increases signal friction and wear. Hydraulic fluid temperature rise indicates pump stress or inefficient cooling. Abnormal hot spots on equipment surfaces reveal internal friction or electrical issues.
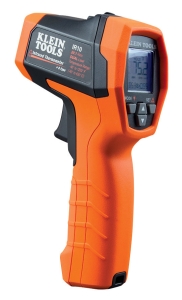
The CBM Infrared thermometer with type K input measures -40 to 650°C with 20:1 optical resolution, allowing plant managers to scan equipment surfaces weekly without disassembly. The adjustable emissivity (0.10–1.00) handles different surface finishes—critical in Singapore's diverse manufacturing sectors. IP54 rating with 3 m drop protection suits field-intensive environments. Type K input support enables connection to data loggers for automated trending.
Temperature trending reveals efficiency degradation often invisible to operators. A 5–10°C rise in hydraulic system temperature over two weeks, even without pressure changes, indicates filter clogging, pump internal leakage, or cooling system problems—each requiring different corrective action.
Section 2: Flow and Pressure Differentials—Detecting System Blockages
Flow measurement combined with pressure differential trending detects the hidden problems that cause gradual system degradation: filter saturation, line restrictions, or internal component wear.
The Dwyer Medium flow metal probe MAFS-20 provides medium-range flow measurement with a 71 cm probe length, suitable for process piping common in Singapore food processing, chemical manufacturing, and utilities. Flow probes positioned at system entry and exit points reveal whether flow is being lost internally (suggesting internal leaks) or restricted externally (suggesting blockages).
When combined with pressure measurement, flow trending reveals system efficiency loss clearly. Consider this practical scenario: Your plant's hydraulic press shows stable pressure but declining flow over three weeks. Pressure remains constant because the pump compensates by working harder. Your infrared thermometer shows pump temperature rising 2°C weekly. Pressure transmitter data shows pressure ripple increasing. These three trends together—stable pressure, declining flow, rising temperature, increasing pressure ripple—point definitively to internal pump leakage. Without trending, you might blame the cooling system or begin random troubleshooting.
Section 3: Protection and Safety Thresholds Through Pressure Switching
While trending provides diagnostic insight, pressure switches provide real-time protection. However, pressure switches themselves are part of your measurement and detection strategy—they enforce the limits your trending data has determined are safe.
The Dwyer Pressure switch DXW-11-153-4 features a setpoint range of 0.41–0.55 bar with differential range of 3.46–5.17 bar, making it suitable for low-pressure pneumatic and cooling systems common in Singapore facilities. IP65 protection and 5 A capacity at 125/250 VAC ensure reliability in humid industrial environments.
The operational strategy is this: Use your transmitters and manual gauges to trend normal operating pressure ranges over a month. Identify the highest safe pressure under maximum load. Set your pressure switch setpoint 5–10% below this threshold. The switch then becomes an automated guardian, protecting equipment and preventing damage that would show up in your trending data as catastrophic rather than gradual change.
This approach also protects against human error. Operators may miss visual gauge readings or ignore trending data on screens. A pressure switch enforces protection regardless of attention, complementing your trending program rather than replacing it.
Section 4: Implementing Measurement & Detection Trending in Your Facility
Establishing Baselines
Your first trending task is establishing baseline measurements for each critical system under known-good conditions. Choose a system you trust to perform reliably—newly installed or recently overhauled equipment. For one week, record pressure at three times daily, temperature at the same times, and flow readings during peak operation. Document operating conditions: ambient temperature, load percentage, runtime hours.
Baselines must account for Singapore's climate. Temperature will be higher in equipment rooms than in air-conditioned facilities. Humidity affects electrical readings differently in different locations. Your baseline becomes your reference; trends are meaningless without it.
Selection and Placement Strategy
Don't attempt to trend everything. Select the five to eight most critical systems—those whose failure would halt production, endanger workers, or cost most to repair. Typically: main hydraulic system, critical pneumatic circuit, cooling system, compressed air line, and any custom-critical process system.
For each system, place instruments at three points: system input (after pump/compressor), system output (after load/use point), and return/exhaust line. This three-point approach reveals whether changes occur during energy conversion, during load application, or in return paths—instantly diagnosing many problems.
Data Collection Discipline
Trending fails when data collection becomes sporadic. Establish a weekly routine: Same day, same time, same measurement order. Use a simple spreadsheet or electronic logbook. Record not just numbers but conditions: "Monday 09:00, ambient 32°C, system running at 75% load, idle for 2 hours prior, pressure 85 bar, temperature 58°C."
Annotations matter. If pressure jumps 10 bar one week, and you note "filter changed Monday," you've learned something valuable. If you can't explain the change later, you can't diagnose effectively.
Acting on Trends
A trend becomes actionable when a parameter changes 5–10% from baseline consistently over two weeks, or changes 15% in a single week. Don't react to single outlier readings; react to patterns.
When you identify a concerning trend:
1. Confirm with manual instruments. Transmitter malfunction is more common than equipment failure. Verify the trend with your Preciman manometer or infrared thermometer.
2. Cross-reference other parameters. If pressure is rising but temperature is stable and flow unchanged, the transmitter may be drifting rather than the system changing.
3. Document and schedule. Don't immediately shut down for a 5% pressure rise. Schedule maintenance during planned downtime. Trending gives you this luxury of planning.
4. Record your findings. When maintenance is completed, record what was found and corrected. Over time, this becomes a diagnostic reference library for your specific equipment.
Why 3G Electric Supports Measurement & Detection Success
With over 35 years distributing industrial measurement equipment to Singapore facilities, 3G Electric understands that trending success depends on instrument reliability, not just sophistication. We supply the precision gauges, transmitters, and probes that perform consistently in Singapore's humid, challenging industrial environments.
We also understand that no single instrument solves trending. Pressure transmitters need manual gauge backup. Infrared thermometers complement type K thermocouple inputs. Pressure switches enforce what trending suggests should be limits. Effective plants use multiple measurement approaches to triangulate the truth about their equipment.
Our experience working with plant managers across Singapore's petrochemical, food manufacturing, utilities, and facilities sectors has revealed that the plants with the best reliability records aren't those with the newest equipment—they're those with the most disciplined measurement and detection practices. Trending transforms expensive, sophisticated equipment into a diagnostic capability available to every plant manager.
Conclusion
Measurement & Detection for trending is ultimately about converting data into foresight. Rather than waiting for alarms or failures, you identify the early warnings that equipment is beginning to struggle. In Singapore's 24/7 industrial operations, this foresight saves both the unplanned downtime that damages customer relationships and the emergency repairs that drain maintenance budgets.
Start with one critical system. Establish baselines. Collect data consistently for six weeks. You will be surprised at the patterns you discover—and at how clearly those patterns point toward needed maintenance before your equipment forces your hand. That shift from reaction to prediction is where measurement and detection delivers its greatest value.