
Understanding Measurement & Detection for Predictive Asset Health
Measurement & Detection technology isn't just about reading numbers—it's about recognizing patterns that signal trouble ahead. For maintenance teams across Southeast Asia's industrial sector, the ability to detect subtle changes in pressure, temperature, and flow before systems fail can mean the difference between planned maintenance and emergency shutdown.
With over 35 years of experience distributing industrial equipment throughout the region, 3G Electric has observed how maintenance teams that implement continuous measurement systems dramatically reduce unplanned downtime. The principle is straightforward: small changes compound. A gradual pressure drop that goes unnoticed becomes a complete system failure. A slow temperature rise becomes component damage.
This guide provides practical frameworks for using Measurement & Detection instruments to catch problems when they're still manageable—before they cascade into production losses.
Section 1: Building Your Baseline – The Foundation of Predictive Detection
Before you can detect abnormal behavior, you need to establish what normal looks like. This baseline measurement phase is where many maintenance teams falter, but getting it right transforms your entire detection strategy.
Establishing Initial Operating Parameters
When equipment runs normally, record everything:
- Operating pressure ranges under standard load
- Temperature bands during typical production cycles
- Flow rates at different operational speeds
- Seasonal variations (critical in Southeast Asia's tropical climate where humidity and ambient temperature fluctuate dramatically)
For hydraulic and pneumatic systems common in Southeast Asian manufacturing, the Preciman Manometer ABS vert D80 0/+16bar G1/2 provides the ±2.5% accuracy needed to establish reliable pressure baselines. Its glycerin-filled design handles the high humidity environments typical across the region without losing precision.
Documentation Strategy for Maintenance Teams
Create a simple spreadsheet for each critical asset:
- Date and time of measurement
- Ambient conditions (temperature, humidity—especially important in Southeast Asia)
- System load or production rate
- Measurement values
- Operator or technician name
Capture measurements at the same time of day, under consistent load conditions. After 30 days, you'll have a reliable baseline. After 90 days, you'll recognize seasonal patterns and weekly cycles.
Section 2: Real-Time Detection – Recognizing the Warning Signs
Once baselines are established, maintenance teams shift to active monitoring—catching deviations before they become failures.
Pressure Monitoring for Early Fault Detection
Pressure changes often precede failure by weeks:
- Gradual rise (1–2 bar over days): Indicates filter clogging or seal degradation. Maintenance action needed within 48 hours.
- Sudden spikes (3+ bar increase in minutes): Potential blockage or relief valve malfunction. Investigate immediately.
- Steady decline (0.5–1 bar per day): Suggests internal or external leaks. Small leaks are cheap to fix; catastrophic seal failure is expensive.
For low-pressure applications, the Dwyer Pressure switch DXW-11-153-4 with its 0.41–0.55 bar setpoint range and IP65 protection can trigger automatic alerts when pressure drifts beyond acceptable bands, even in humid Southeast Asian facilities.
For continuous monitoring systems, the Dwyer Transmitter 629-05-CH-P2-E5-S1 delivers 4-20 mA output with 0.5% accuracy, integrating seamlessly with plant SCADA systems for real-time trending.
Temperature Detection for Component Health
Temperature is a leading indicator of multiple failure modes:
- Bearing degradation: Temperature rises 5–10°C above baseline
- Fluid oxidation: Hydraulic fluid breaks down faster at elevated temperatures (especially critical in tropical Southeast Asia)
- Electrical resistance: Motor windings degrade as temperature climbs
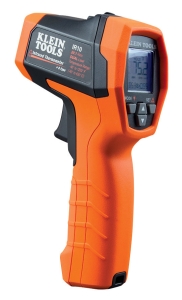
The CBM Infrared thermometer with type K input measures across -40 to 650°C with 20:1 optical resolution, allowing technicians to spot hot spots on equipment without contact. In humid environments, its IP54 rating and rugged 3 m drop protection survive field conditions. Adjustable emissivity (0.10–1.00) accommodates different surface finishes—critical when monitoring painted equipment, polished components, and raw metal surfaces.
Flow Rate Monitoring for Process Efficiency
Flow degradation often goes unnoticed until capacity suffers. The Dwyer Medium flow metal probe MAFS-20 with its 71 cm probe length and 1/4-20 thread connection integrates into existing process lines for continuous flow monitoring. Flow decline signals:
- Pump wear (impeller erosion reduces output)
- Internal leakage (seal wear allows bypass)
- Cavitation (indicates suction-side problems)
Section 3: Data Interpretation – From Numbers to Action
Maintenance teams often collect data but struggle with interpretation. This section provides decision frameworks.
Reading Trends, Not Just Snapshots
A single high-pressure reading means nothing. A steadily climbing pressure trend over two weeks means plan maintenance. This is the difference between reactive and predictive maintenance.
Southeast Asia-Specific Factors
Maintenance teams across the region must account for:
- Humidity impact: Equipment performance changes with seasonal monsoon patterns. Summer measurements won't match winter baselines.
- Load seasonality: Production cycles often shift with agricultural seasons or export demand patterns.
- Power quality: Voltage fluctuations affect motor and transmitter performance; always note power conditions when troubleshooting.
- Ambient temperature: Tropical heat accelerates fluid degradation; temperature baselines shift 5–10°C between seasons.
Define clear intervention points:
- Green zone (baseline ±5%): Continue normal operation, standard monitoring
- Yellow zone (baseline ±5–10%): Increase monitoring frequency to daily, schedule maintenance within 2 weeks
- Red zone (baseline ±10%+): Alert supervisor, schedule maintenance within 48 hours, prepare backup equipment
This approach prevents over-maintenance (costly reactive interventions on equipment running fine) and under-maintenance (missing failures).
Section 4: Implementation Roadmap – From Planning to Continuous Monitoring
Rolling out Measurement & Detection systems requires phased implementation.
Phase 1: Identify Critical Assets (Week 1–2)
Not everything needs continuous monitoring. Maintenance teams should prioritize:
- Equipment with highest downtime cost (production line bottlenecks)
- Systems with recent failures or poor reliability history
- Assets nearing end of service life (early warning catches catastrophic failure)
- Mission-critical infrastructure (backup power systems, cooling systems for electronics manufacturing)
For each critical asset, install three standard measurement points:
1. Inlet pressure: Detects supply-side problems
2. Outlet pressure: Reveals component-level blockages or seal wear
3. Operating temperature: Tracks thermal stress
Use color-coded tape (green = good, yellow = monitor, red = action required) to help technicians quickly assess equipment status during shift rounds.
Phase 3: Establish 30-Day Baseline (Week 5–8)
Collect daily measurements under normal operating conditions. Record maintenance team observations (any unusual noise, vibration, or behavior). After 30 days, calculate baseline ranges and define action thresholds using the three-zone model above.
Phase 4: Deploy Continuous Monitoring (Week 9+)
Transition to daily or weekly measurement schedules. Train maintenance teams to:
- Use tools correctly (proper probe placement, emissivity adjustment for infrared thermometers)
- Interpret trends (not just individual readings)
- Document findings (maintains historical record for future problem-solving)
- Escalate appropriately (yellow and red zone alerts go to supervisors)
As your regional distributor for over 35 years, 3G Electric provides more than equipment. Our technical team helps maintenance operations:
- Specify appropriate instruments for your specific equipment and environment
- Troubleshoot measurement anomalies
- Recommend calibration and maintenance schedules
- Identify replacement instruments when technology advances warrant upgrades
Best Practices for Southeast Asian Maintenance Teams
Climate Considerations
Tropical humidity degrades mechanical instruments and electronic sensors. Schedule calibration checks every 6 months (versus annual schedules common in temperate climates). Store instruments in climate-controlled spaces when not in use.
Language and Documentation
Maintenance teams often include operators with varying technical backgrounds. Document measurement procedures with simple diagrams and multilingual labels. This ensures consistent data collection regardless of shift or personnel changes.
Spare Parts Strategy
Keep backup measurement instruments for critical measurement points. A failed thermometer that stops temperature monitoring defeats the entire predictive system. Budget for redundancy, especially for pressure transmitters integrated into SCADA systems.
Training and Ownership
Assign one technician per shift as "measurement owner." This person becomes expert in equipment operation, troubleshooting instrument faults, and escalating findings. Rotate this role quarterly to build team-wide competency.
Conclusion
Measurement & Detection systems transform maintenance from reactive crisis management to proactive asset stewardship. For Southeast Asian manufacturing facilities where production downtime directly impacts export deadlines and customer relationships, early failure prediction isn't a luxury—it's a competitive necessity.
The investment in proper instruments—pressure manometers, flow probes, temperature sensors, and pressure transmitters—pays for itself within months through avoided emergency shutdowns. Start with your most critical assets, establish reliable baselines, monitor for trends, and act decisively when thresholds are exceeded.
3G Electric stands ready to support your maintenance team with quality instruments, technical guidance, and regional expertise developed across 35 years of industrial equipment distribution throughout Southeast Asia.