
Understanding Measurement & Detection for Equipment Uptime
Measurement & Detection systems form the nervous system of your industrial operation. Rather than reacting to equipment failures, modern plant managers use continuous measurement and detection capabilities to spot problems before they become costly shutdowns.
With 35+ years of experience serving industrial operations globally, 3G Electric has helped plant managers transform their maintenance strategies from reactive to predictive. The difference is significant: preventing a single catastrophic equipment failure typically saves 10–15 times the cost of regular monitoring equipment.
Your measurement and detection strategy directly impacts three critical metrics: mean time between failures (MTBF), overall equipment effectiveness (OEE), and maintenance budget predictability. When you detect pressure anomalies, temperature spikes, or flow rate deviations early, you create a maintenance window to address issues during planned downtime rather than suffering emergency shutdowns.
Core Measurement Points Every Plant Manager Should Monitor
Pressure Systems as Your First Warning Signal
Pressure is the leading indicator of system distress. In hydraulic, pneumatic, and fluid systems, pressure changes signal pump wear, seal degradation, filter clogging, or imminent component failure.
The Preciman Manometer ABS vert D80 0/+16bar G1/2 provides ±2.5% accuracy across 0–16 bar range, making it ideal for fixed-point monitoring stations. The glycerin-filled design eliminates needle oscillation, giving you stable readings even in vibration-prone environments. Install these at critical junctions—pump discharge, branch circuits, and return lines—to establish baseline pressure profiles.
For systems requiring automated alerts, the Dwyer Pressure switch DXW-11-153-4 monitors pressure continuously and triggers alerts when pressure deviates from your setpoint range (0.41–0.55 bar differential). This switch provides IP65 protection in wet environments and rated at 5 A @ 125/250 VAC, making it compatible with most PLC and control systems.
For real-time data trending and remote monitoring, the Dwyer Transmitter 629-05-CH-P2-E5-S1 outputs 4-20 mA signals directly to your SCADA system. With 0.5% accuracy and IP65 rating, this transmitter converts pressure signals into digital data you can trend over weeks and months to identify degradation patterns before failures occur.
Temperature Monitoring for Thermal Runaway Prevention
Temperature measurement is your second-line defense. Equipment temperature rises precede mechanical failures by hours or days—giving you critical intervention time.
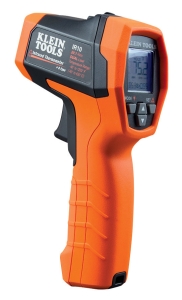
The CBM Infrared thermometer with type K input measures temperatures from -40 to 650°C without contact, making it perfect for monitoring bearing housings, motor casings, transformer shells, and hot surfaces. The 20:1 optical resolution (view distance-to-spot ratio) lets you measure small components accurately from safe distances. Adjustable emissivity (0.10–1.00) compensates for different surface finishes—critical when monitoring polished hydraulic cylinders versus painted motor frames.
Use this tool for weekly thermal surveys of rotating equipment, bearings, and electrical cabinets. Compare readings to your baseline temperatures established during commissioning. Temperature increases of 10–15°C above baseline warrant immediate investigation.
Flow Rate Detection for Efficiency and Safety
Flow rate changes indicate pump cavitation, leakage, filter restrictions, or component blockage. Detecting flow problems early prevents pressure spikes and catastrophic seal failures.
The Dwyer Medium flow metal probe MAFS-20 provides 71 cm reach for inserting into flowing systems without stopping operations. The 1/4-20 thread connection fits standard industrial couplings. Use this probe to:
- Verify pump output matches manufacturer specifications
- Detect branch circuit leakage by comparing inlet versus outlet flows
- Identify filter degradation before pressure differential limits become critical
- Confirm proper distribution to parallel circuits in multi-zone systems
Take flow measurements at the same locations monthly, recording results in a trending log. A 10–15% flow decrease indicates growing restrictions or component wear requiring maintenance planning.
Building Your Measurement Strategy Framework
Phase 1: Establish Baseline Readings
Before implementing continuous detection, document current system conditions across all critical equipment:
1. Map your critical systems: Identify equipment where unplanned downtime costs exceed €5,000/hour (hydraulic presses, cooling loops, compressed air systems, production conveyors).
2. Take initial measurements: Use manual instruments to establish baseline pressure, temperature, and flow rates under normal operating conditions. Record ambient conditions, load conditions, and operating hours.
3. Document specifications: Note manufacturer recommendations for pressure limits, allowable temperature ranges, and expected flow rates. These become your alarm thresholds.
4. Create trending templates: Build simple spreadsheets or use your CMMS to record measurements monthly. Include date, operator, conditions, and readings.
Phase 2: Install Continuous Detection Where Risk Is Highest
Focus initial installation on equipment where:
- Failure cost exceeds €10,000 (production impact, safety risk, or repair cost)
- Historical data shows recurring problems
- Maintenance costs are rising despite preventive efforts
- Operational criticality is high (supports multiple downstream processes)
Prioritize:
1. Main hydraulic pump discharge (pressure transmitter)
2. Critical motor bearings (thermal monitoring)
3. High-flow distribution points (flow probe)
4. Secondary pump discharge (pressure switch for overpressure protection)
Phase 3: Set Intelligent Alarm Thresholds
Avoid nuisance alarms by setting three threshold levels:
Warning Level (80% of maximum): Indicates degradation trend—schedule maintenance within 1–2 weeks.
Alert Level (90% of maximum): Immediate investigation required—plan shutdown within 48–72 hours.
Critical Level (100% of maximum): Automatic shutdown to prevent catastrophic failure—emergency maintenance required.
These thresholds are not fixed. After 3–6 months of data collection, refine them based on actual degradation patterns in your facility.
Practical Implementation for Plant Managers
Weekly Thermal Inspection Protocol
Every Monday morning, conduct a 45-minute thermal survey of rotating equipment and high-load systems using your infrared thermometer:
- Measure bearing housings, motor frames, gearbox casings
- Compare to baseline temperature established during commissioning
- Flag any reading 15°C above baseline for mechanical team investigation
- Record all readings in your CMMS or trending log
This simple weekly routine catches 60–70% of impending failures 2–4 weeks before catastrophic breakdown.
Monthly Pressure Verification
Schedule 90 minutes on the first working day of each month:
- Read all installed pressure gauges (Preciman manometers)
- Compare to baseline readings and manufacturer specifications
- Investigate any pressure 10% below baseline (restriction or pump wear)
- Confirm pressure switch settings remain accurate
- Note any fluctuation or needle oscillation (indicating cavitation)
Quarterly Flow and Efficiency Audit
Once per quarter (during planned maintenance windows):
- Use the flow probe to verify pump outlet flow against manufacturer curves
- Compare flow measurements to previous quarters to identify degradation trends
- Measure pressure at pump discharge while recording flow (detects pump slip)
- Verify pressure drops across filters remain within limits
Integration with CMMS and Predictive Maintenance Software
Transmitters and pressure switches connect directly to your control system or SCADA, enabling:
- Automated data logging for trend analysis
- Historical comparison to identify seasonal patterns or load-related changes
- Predictive alerts based on rate-of-change (not just absolute values)
- Integration with work order systems to trigger automatic maintenance requests
Overcoming Common Implementation Challenges
Challenge 1: Budget Constraints
Start with your three highest-risk systems. Install one transmitter and implement weekly manual thermal monitoring. This costs €1,200–1,800 but frequently prevents €50,000+ failures. Expand in phases as ROI becomes evident.
Challenge 2: Staff Resistance to New Procedures
Frame measurement & detection as reducing operator burden, not creating new work. Automated pressure switches and transmitters eliminate manual gauge reading. Weekly thermal scans take 45 minutes and catch problems before emergency calls. Build staff buy-in by sharing failure prevention stories.
Challenge 3: Data Overwhelm
Start simple: trend only pressure, temperature, and flow at your three critical systems. After mastering this, add complexity. Most facilities succeed with 8–12 trend parameters, not 80. Focus on actionable data, not comprehensive data.
Challenge 4: Calibration and Maintenance of Instruments
3G Electric supplies calibration services and replacement parts for all instruments listed. Schedule annual calibration of pressure transmitters and switches through our service team to maintain ±2.5% accuracy. Keep spare manometers on hand (€80–120 each) for quick replacement during maintenance windows.
Measuring Success: ROI Metrics Plant Managers Track
After 6–12 months of implementation, measure impact using these metrics:
- MTBF improvement: Target 20–35% increase in time between unplanned failures
- Maintenance cost predictability: Unplanned repair costs should drop 30–50%
- OEE gains: Equipment availability should improve 5–10 percentage points
- Energy efficiency: Trend power consumption and cooling costs; should stabilize or decrease
- Safety incidents: Pressure ruptures, thermal failures, and oil spills should decline significantly
Most plant managers see positive ROI within 12–18 months, with payback periods of 18–36 months on comprehensive systems.
Working with 3G Electric for Measurement & Detection Solutions
As a global distributor with 35+ years supporting industrial operations, 3G Electric provides:
- Product selection guidance aligned to your facility's specific equipment and risks
- Installation support and technical documentation for certified professionals
- Spare parts inventory ensuring replacement instruments within 48 hours
- Calibration services maintaining ±2.5% accuracy per ISO 9001 standards
- Training for your team on data trending and threshold setting
Our technical team has helped plant managers worldwide transition from emergency maintenance to predictive asset care. Contact us for a facility assessment and measurement strategy recommendation tailored to your equipment and budget.