Understanding Measurement & Detection in Predictive Maintenance
Measurement & Detection forms the foundation of any predictive maintenance program. Rather than waiting for equipment to fail, maintenance teams use precise instruments to monitor temperature, pressure, electrical parameters, and other critical variables that signal impending problems. With over 35 years of experience supporting global industrial operations, 3G Electric has helped thousands of maintenance teams transition from reactive repairs to data-driven prevention strategies.
Predictive maintenance delivers measurable returns: extended equipment lifespan, reduced downtime, lower energy costs, and improved safety. The key is deploying the right measurement tools and understanding what the data tells you. Modern maintenance teams work with increasingly complex HVAC systems, hydraulic installations, electrical networks, and refrigeration units—each requiring specialized measurement instruments and interpretation skills.
This guide focuses on practical techniques maintenance teams can implement immediately to strengthen their measurement and detection capabilities, regardless of facility size or industry vertical.
Section 1: Core Measurement Instruments for Predictive Maintenance Programs
Temperature Monitoring as Your Primary Detection Tool
Temperature measurement is the most reliable early warning system for equipment distress. Abnormal heat signatures often precede mechanical failure by days or weeks, giving maintenance teams a critical window to intervene. Different applications demand different measurement approaches:
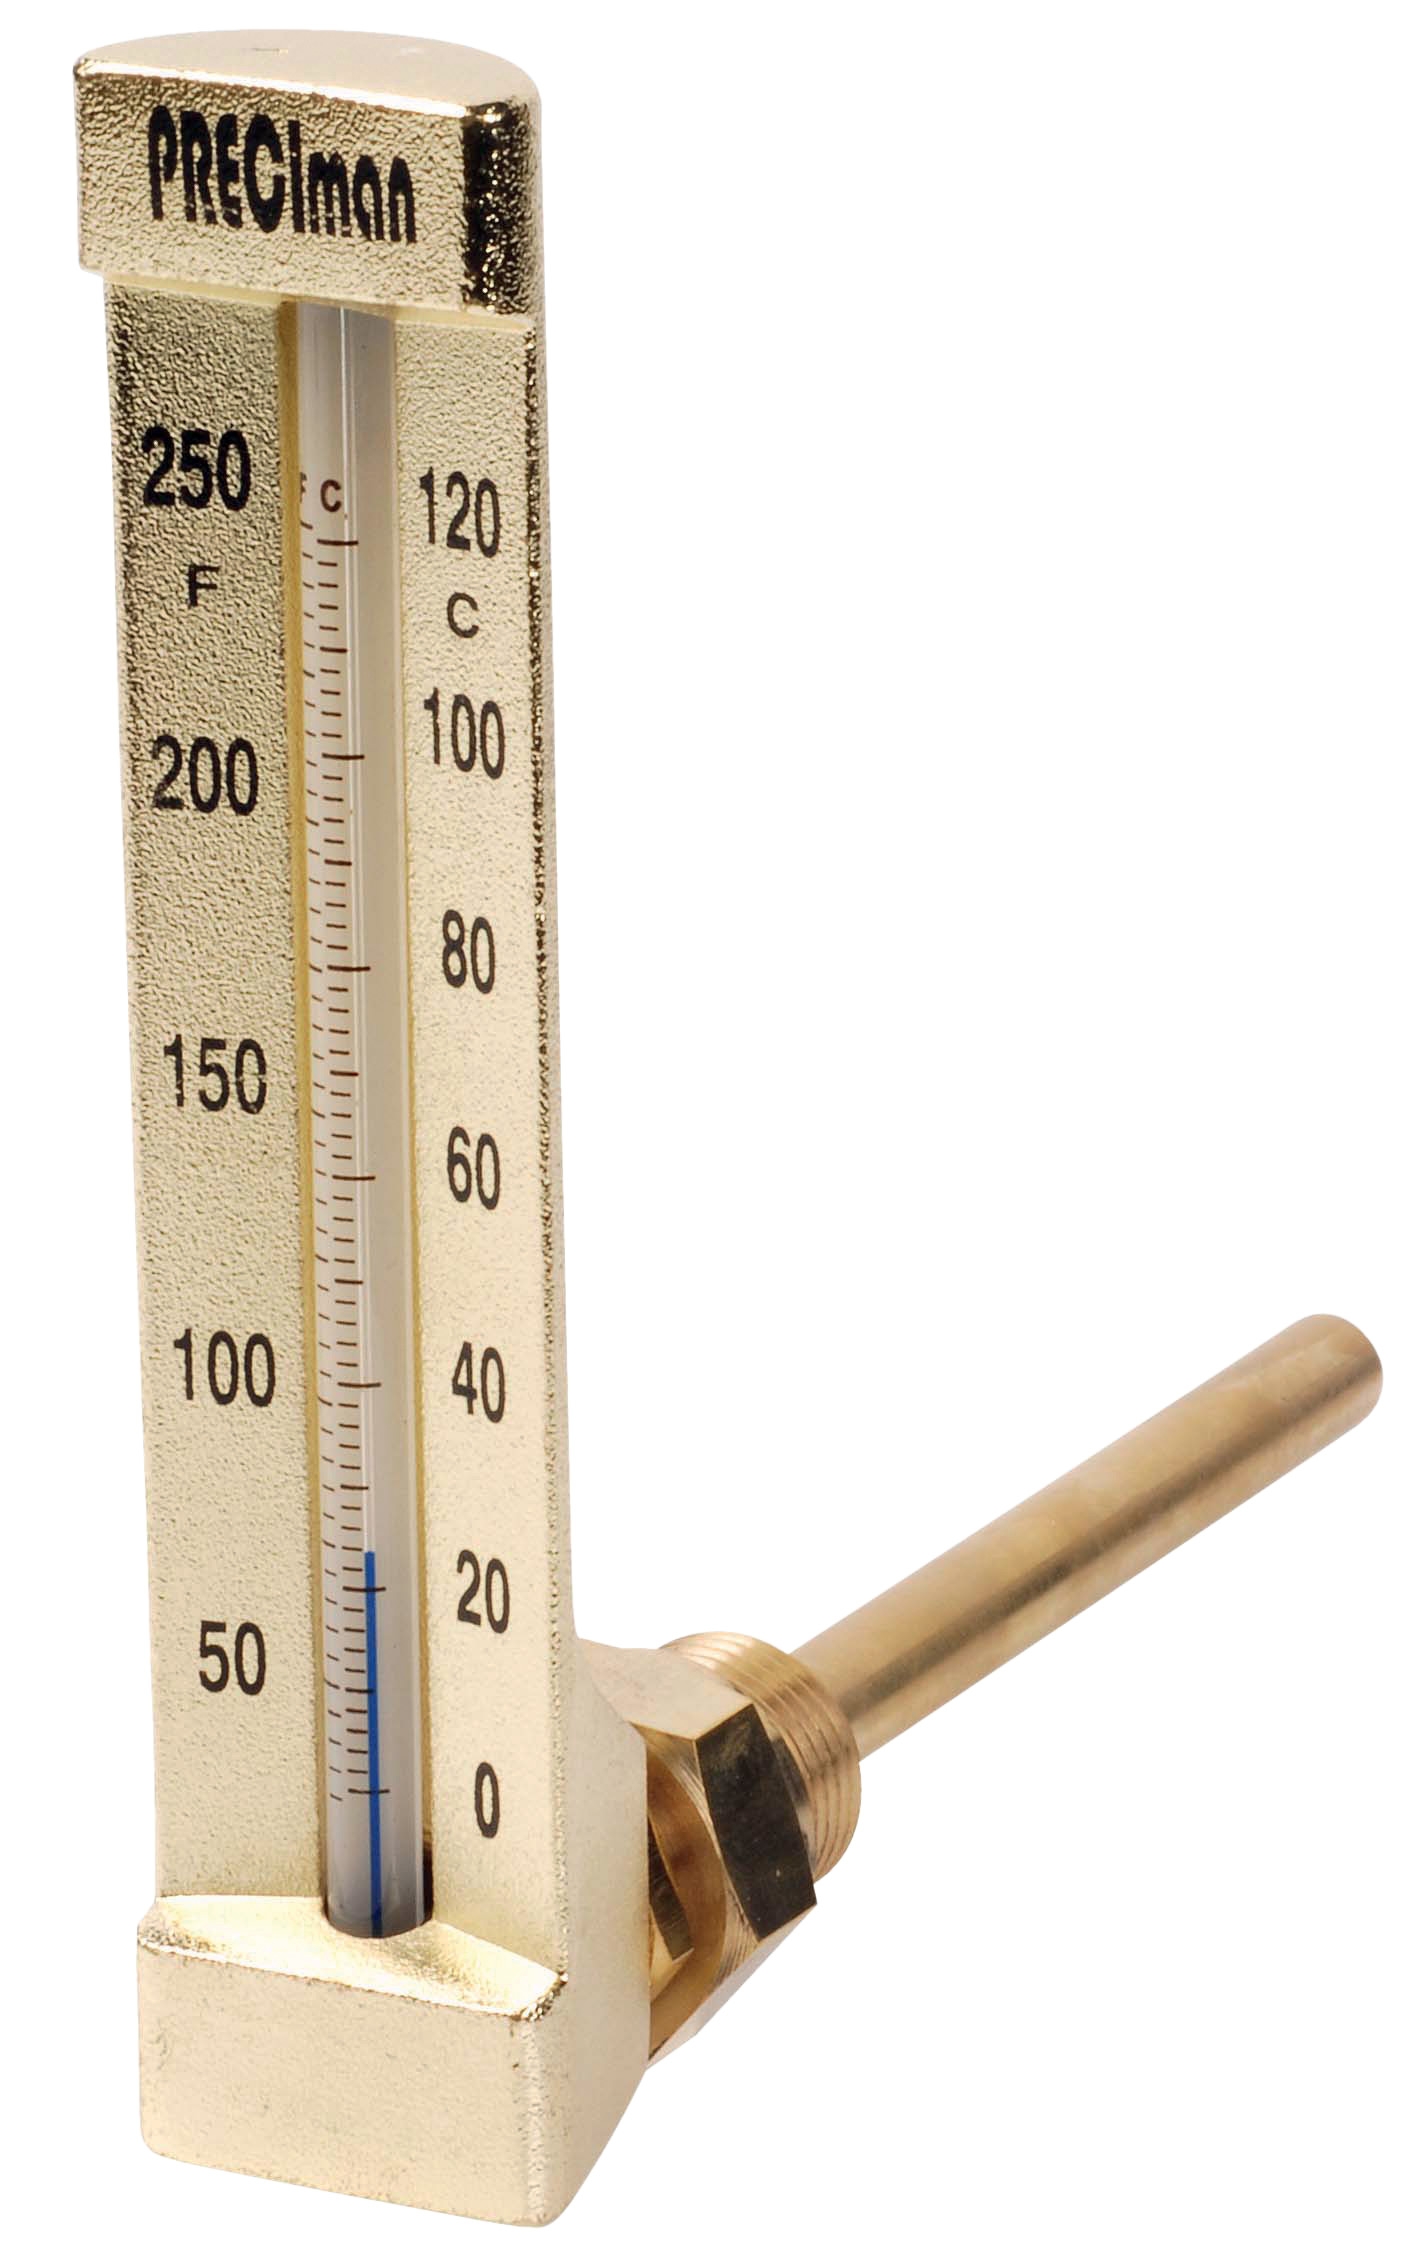
Immersion Thermometers for Direct System Monitoring: For liquid-based systems like hydraulic reservoirs, chiller loops, and thermal storage tanks, immersion thermometers provide immediate temperature readings at the point of concern. The CBM Industrial Thermometer 0/+50°C with immersion probe delivers accuracy in industrial settings where equipment operates at moderate temperatures. The right-angle design suits confined spaces where standard configurations won't fit, and the 150mm height accommodates various pipe and tank configurations.
Axial Thermometers for Compact Applications: Smaller diameter systems—refrigeration circuits, precision cooling loops, and instrument calibration stations—require compact measurement solutions. The CBM Axial Thermometer D65 -40/+40°C fits confined thermowell installations while maintaining ±2°C accuracy across its full range. The 5cm immersion length works well for wall-mounted measurements where you're detecting gradual temperature drift in circulating fluids.
Large-Scale Temperature Detection: Larger diameter systems and visual readability from distance require vertical-mount thermometers with generous display faces. The CBM Green Vertical Thermometer D80 -30/+50°C provides excellent visibility in busy equipment rooms where multiple technicians need to verify conditions. The 10cm immersion length captures representative temperatures in thermal storage tanks and large chiller circuits where thermal stratification occurs.
Electrical and Functional Parameter Detection
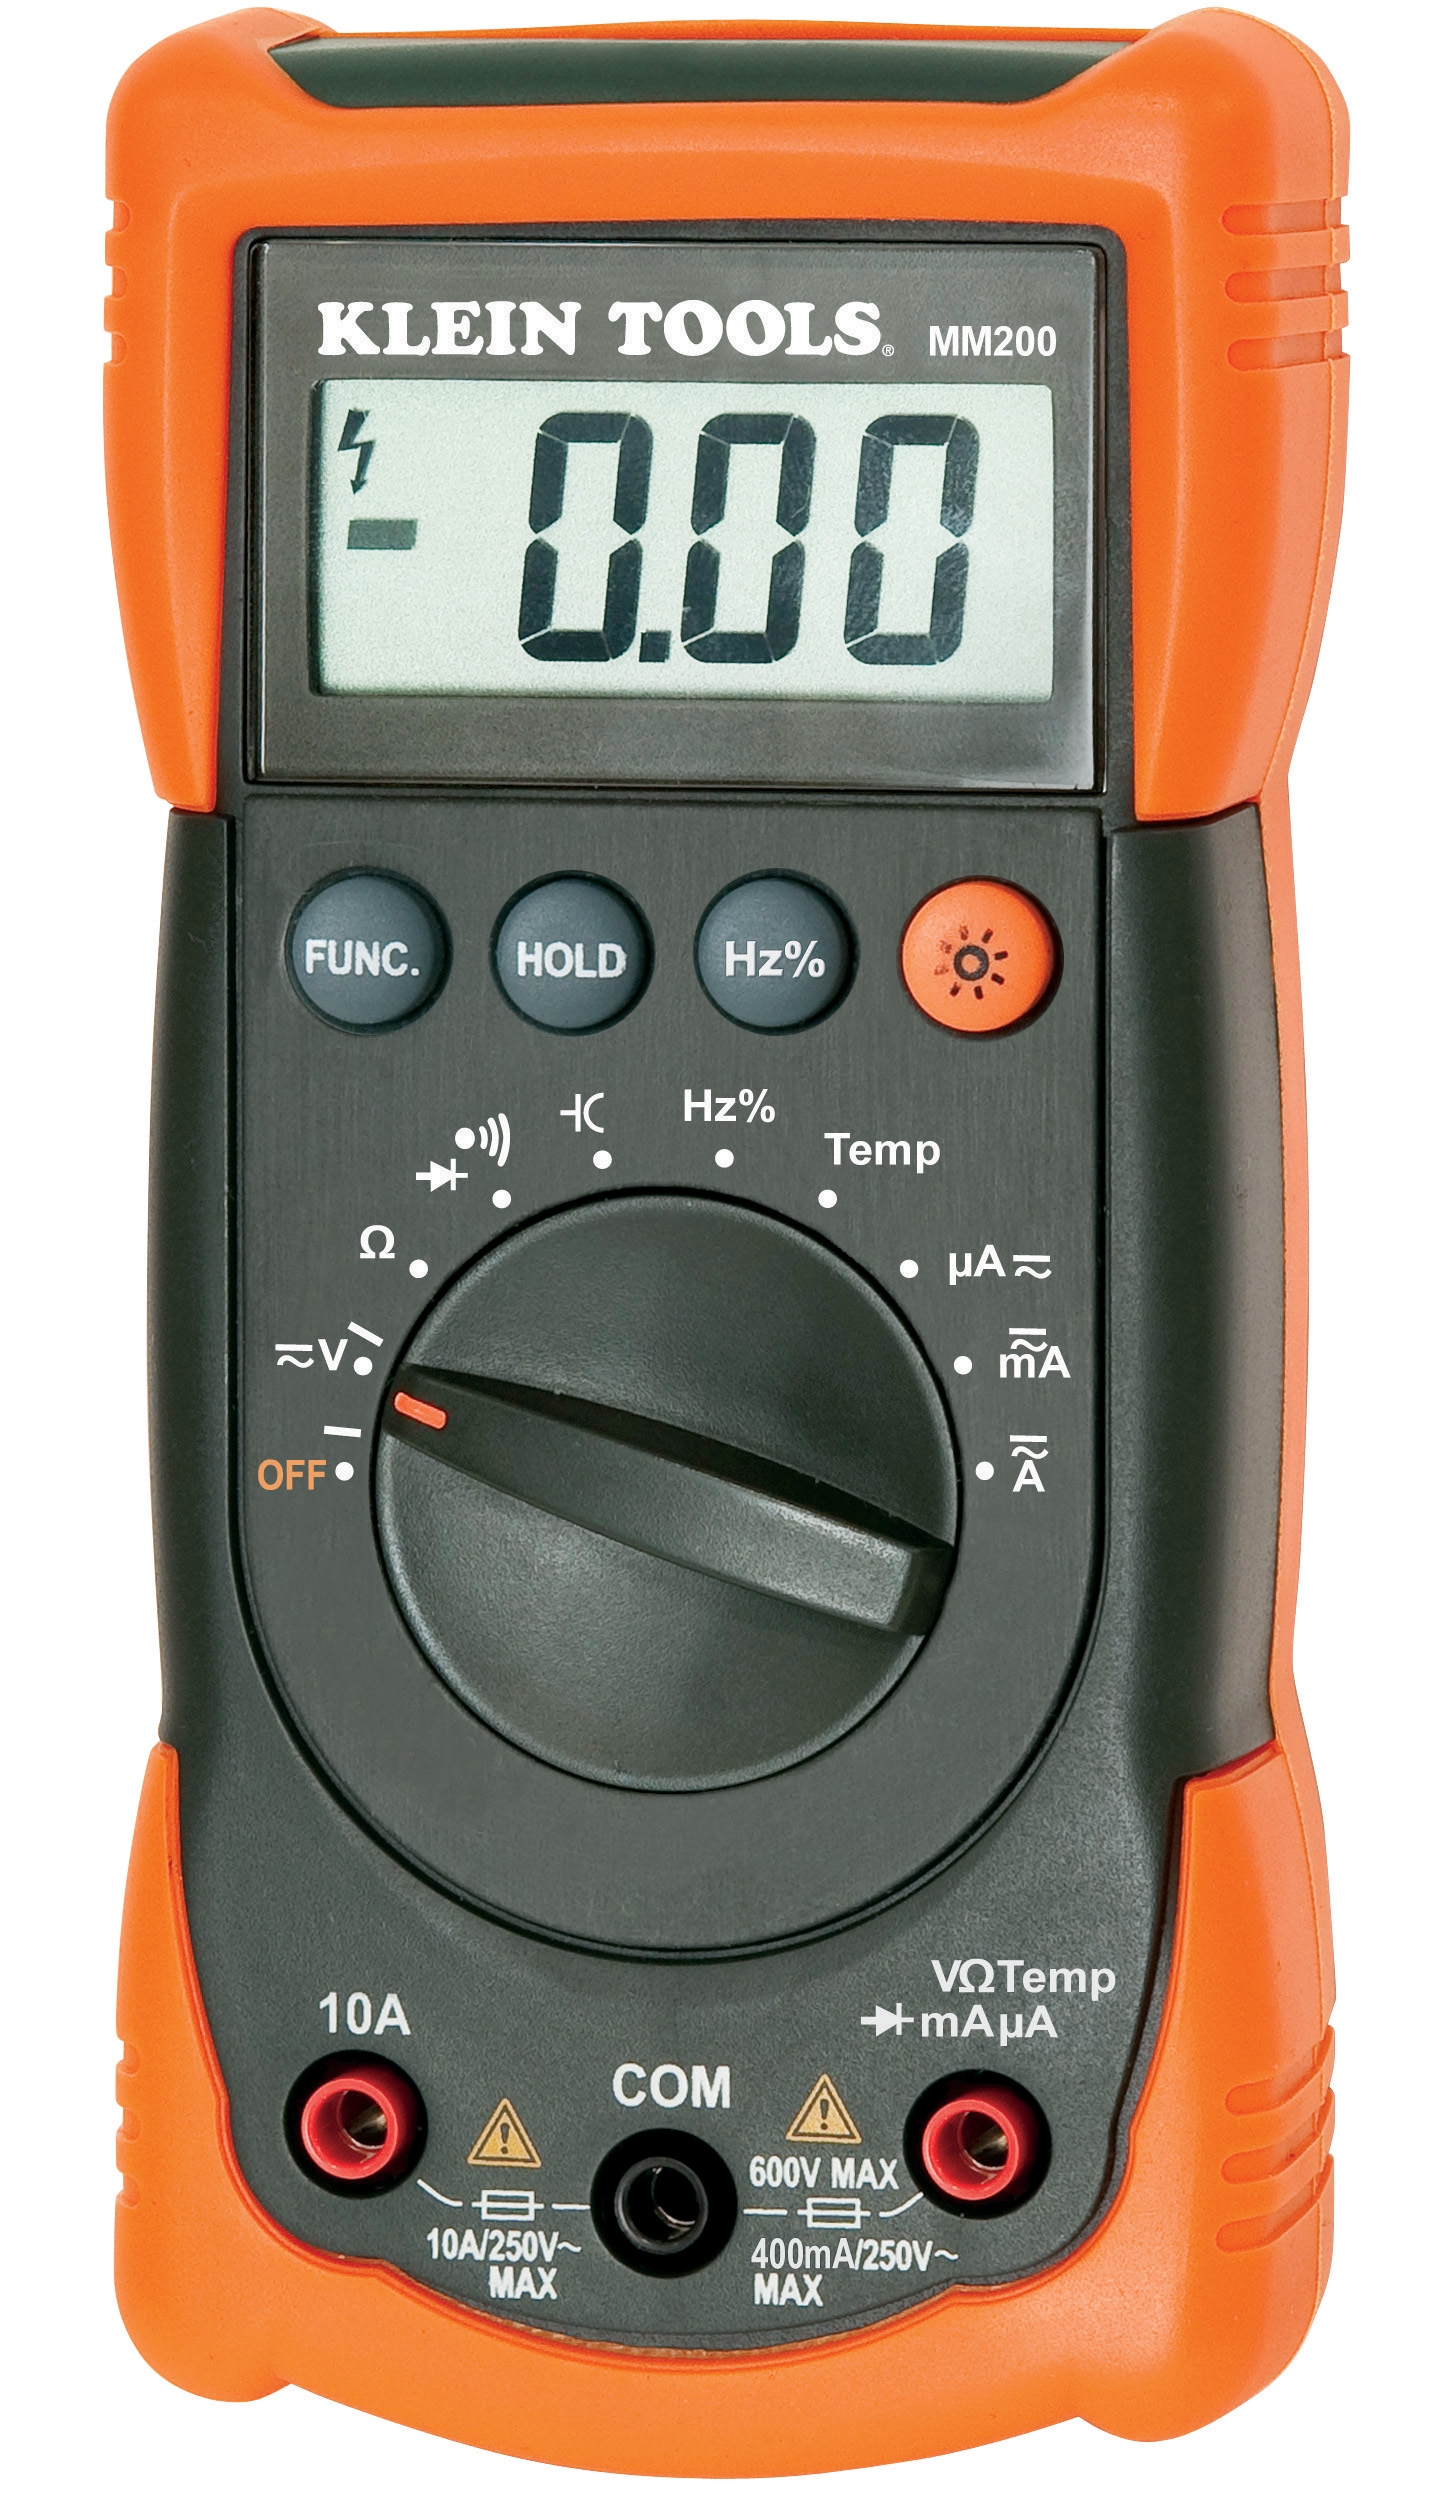
Temperature alone cannot detect every failure mode. Electrical degradation, phase imbalance, and circuit anomalies require dedicated detection instruments. The CBM Automatic Multimeter MM420 combines voltage, resistance, and continuity measurement in a single instrument, allowing maintenance teams to verify motor windings, check circuit integrity, and detect electrical deterioration before catastrophic failure. Auto-ranging and backlit display features ensure accurate readings in dim equipment rooms where many installations live.
System Pressure Measurement and Detection
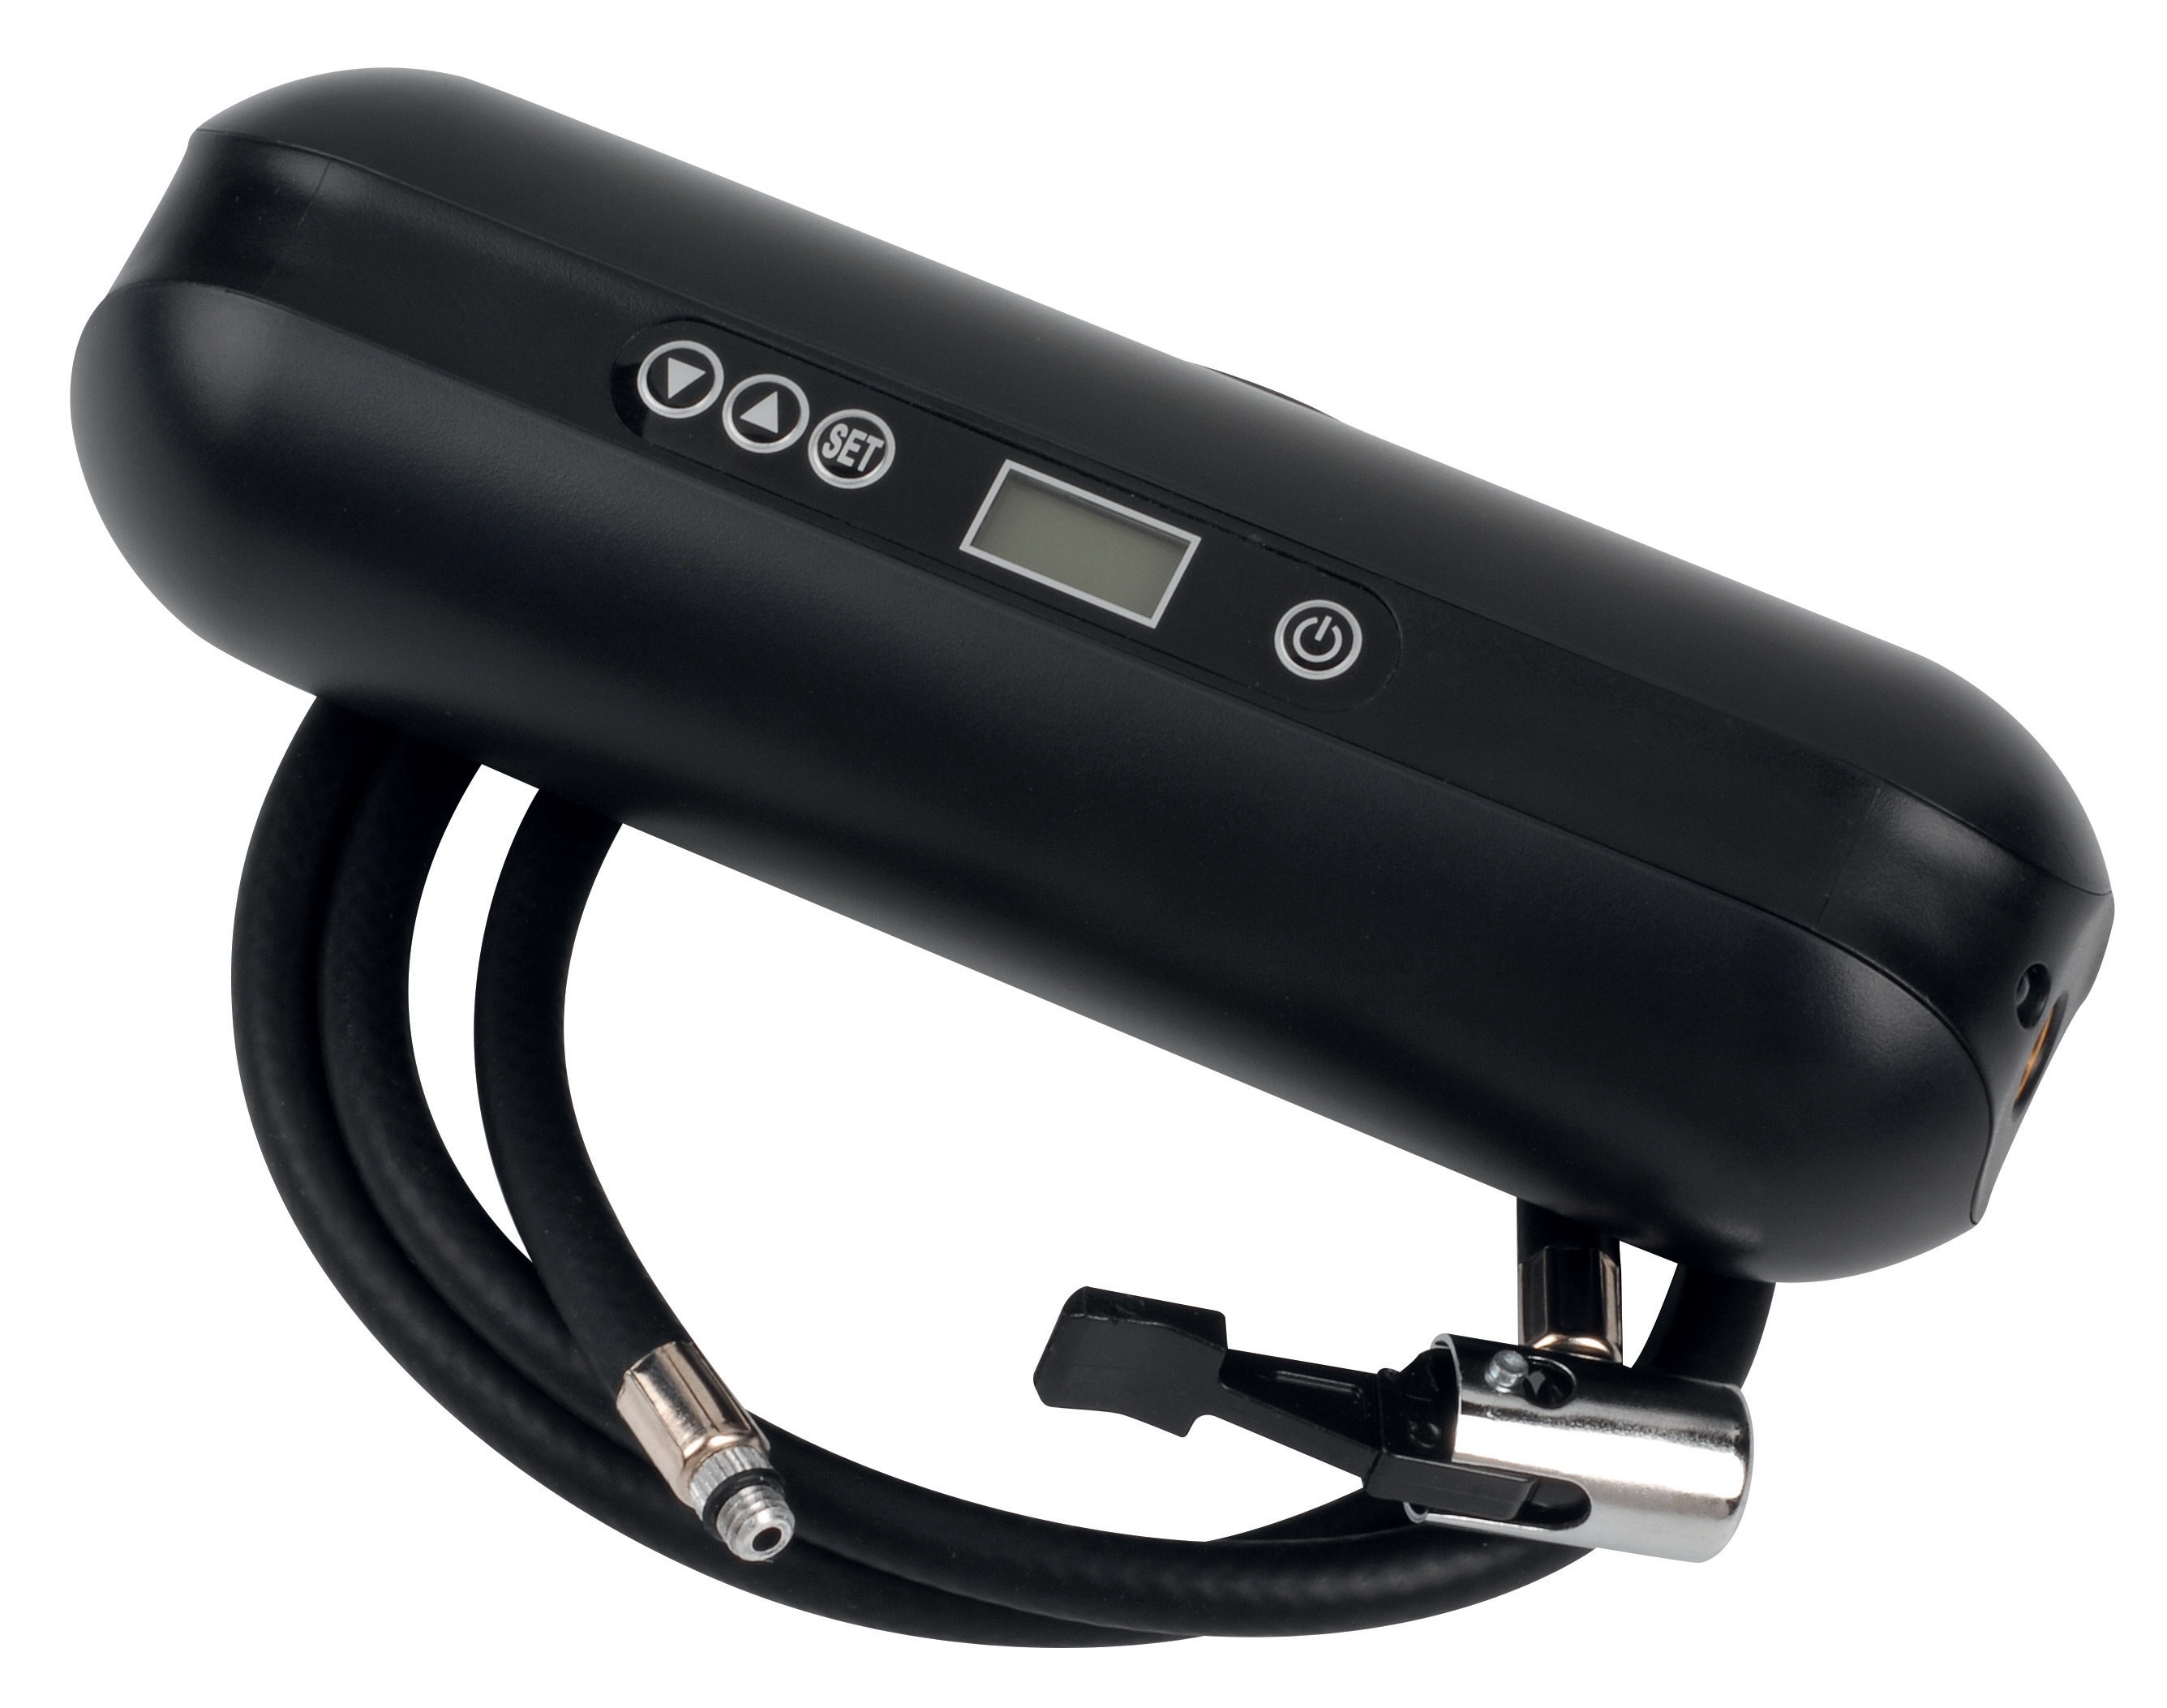
Pressure trending reveals compressor efficiency, pump wear, and blockage development. For expansion tank systems common in hydronic heating and cooling, maintaining proper pre-charge pressure is critical. The CBM Expansion Tank Inflator Battery 2000 mAH enables quick pressure checks and re-inflation without removing tanks from service. The 2000 mAH battery capacity supports multiple seasonal maintenance cycles between charges, and the portable design fits technician tool kits for field work.
Section 2: Establishing Measurement Protocols for Consistent Detection
Creating Your Baseline Dataset
Predictive maintenance requires comparison data. Before you can detect abnormal conditions, you must establish what "normal" looks like for your specific equipment under actual operating conditions. Implement this three-step baseline process:
1. Measure under typical operating loads - Record temperature, pressure, and electrical parameters when systems operate at 60-80% capacity. This "normal running" baseline is more valuable than nameplate specs because it reflects your actual facility conditions, ambient temperatures, and load patterns.
2. Document seasonal variations - Systems behave differently in winter versus summer. Take baseline measurements across all seasons before declaring your reference data complete. A chiller running at 8°C discharge temperature in December is normal; the same temperature in July signals trouble.
3. Record multiple data points - Single measurements mislead. Take readings at five-minute intervals during a one-hour observation period, then calculate average and range. This reveals normal operating fluctuation (typically ±2-3°C for temperature) versus suspicious drift patterns.
Systematic Measurement Scheduling
Inconsistent measurement schedules produce inconsistent detection results. Establish predictable intervals that balance workload against detection sensitivity:
Monthly Routine Checks: Temperature and pressure measurements on critical systems should occur during regularly scheduled maintenance visits. Use the same thermometer location, time of day, and load conditions monthly so data comparisons remain valid. Monthly frequency catches gradual degradation while allowing seasonal adjustments.
Quarterly Electrical Verification: Test motor circuits, control wiring, and sensor connections quarterly using your multimeter. Electrical deterioration often develops invisibly—rising resistance in connections, insulation breakdown in wiring, and component drift in control circuits. Quarterly electrical checks catch these issues before they propagate into system failures.
Annual Calibration Verification: Even quality instruments drift. Annually verify your thermometers and multimeter against known reference standards. Most industrial facilities maintain a reference thermometer and precision resistor set specifically for this purpose. Document calibration results; deviation beyond ±2% triggers instrument recalibration or replacement.
Data Recording and Trend Analysis
Measurements without records are wasted effort. Establish a simple logging system—even a spreadsheet works initially:
- Date and time of measurement
- Equipment identifier (Unit 3A Chiller, Pump B discharge, etc.)
- Measured value (temperature, pressure, voltage, resistance)
- Operating condition (idle, 25% load, 75% load, full load)
- Ambient conditions (outdoor temperature, humidity)
- Technician name and any observations
After 3-4 months of consistent recording, patterns emerge. You'll notice that chiller discharge temperature drops 1.5°C from June through August (normal), but this year it's dropping 4°C (abnormal—compressor efficiency degrading). You'll detect that a motor's starting current gradually increases over six months (bearing friction increasing). These trend patterns enable intervention before failure.
Section 3: Advanced Detection Techniques and Interpretation
Thermal Imaging as Supplementary Detection
While thermometers provide point measurements, thermal cameras reveal heat distribution patterns. Use thermal imaging to:
- Identify hot spots in electrical panels suggesting loose connections
- Verify uniform heat distribution across chiller surfaces (uneven distribution suggests internal fouling)
- Detect unexpected temperature variations in pipe runs (blockages create localized heating)
- Confirm thermowell placement is accurate (compare readings between thermometer and thermal image)
Thermometers and thermal imaging complement each other; thermal imaging identifies problem areas, and thermometers provide precise numerical data for trend tracking.
Vibration Detection Without Specialized Equipment
Not every facility can afford vibration analysis instruments, but maintenance teams can detect bearing wear and mechanical looseness through simple tactile methods:
- Place your hand on pump casings and motor frames during operation; abnormal vibration intensity often precedes mechanical failure by weeks
- Use a metal rod or screwdriver as a listening tool—place the handle against your ear and the tip against bearing housing; unusual grinding or squealing sounds indicate wear
- Mark motor shaft positions with temporary marks and observe if marks remain aligned; shifting marks indicate bearing looseness
These techniques supplement instrument-based detection and cost nothing beyond technician attention.
Pressure Trend Detection
Pressure in sealed systems reveals component efficiency:
- Gradual pressure decline (over days/weeks) indicates slow leakage—tighten fittings progressively from high-pressure to low-pressure areas
- Rapid pressure loss (hours) signals major leaks—identify and repair immediately to prevent system damage
- Pressure spikes during normal operation suggest blockages, valve stiction, or compressor discharge pressure rise—inspect filters and check expansion valve operation
- Pressure stability within ±3% of baseline indicates healthy system operation
Regular pressure checks using your expansion tank inflator battery catch these conditions early. The portable design means you can check multiple systems during a single maintenance visit.
Section 4: Integration with Maintenance Management Systems
Connecting Measurement Data to Work Orders
Measurement data gains power when linked to maintenance documentation. When recording a temperature measurement, cross-reference it to the equipment's service history. Did the same reading appear after the bearing replacement? After the compressor overhaul? After refrigerant charging? This context reveals whether measurements indicate normal post-service behavior or developing problems.
3G Electric's 35 years serving global industrial customers shows us that the most effective maintenance teams systematically connect measurement findings to service records. This practice transforms isolated data points into predictive intelligence.
Setting Detection Thresholds and Alert Criteria
Define specific conditions that trigger maintenance action:
- Green Zone: Normal operating range based on your baseline data (e.g., 8-12°C chiller discharge)
- Yellow Zone: Concerning trend requiring investigation within 1-2 weeks (e.g., discharge temperature 12-14°C)
- Red Zone: Immediate action required to prevent failure (e.g., discharge temperature above 14°C or rising more than 2°C per day)
These thresholds vary by equipment type and facility loads. Establish your own based on historical data and manufacturer recommendations.
Training Team Consistency
Measurement accuracy depends on consistent technique. Train all maintenance team members on:
- Proper thermometer positioning in thermowells (fully inserted, no air gaps)
- Multimeter test lead placement for accurate circuit measurements
- Pressure measurement timing (when system is at normal operating temperature)
- Data recording completeness (all fields documented every measurement)
Consistent technique reduces measurement variability and improves detection reliability. Assign one person per shift as the measurement standards officer responsible for verifying proper technique.
Conclusion
Measurement & Detection transforms maintenance from guesswork to data-driven science. By systematically measuring temperature, pressure, and electrical parameters; establishing baseline conditions; tracking trends over time; and connecting measurements to maintenance records, teams prevent failures rather than merely repairing them.
The instruments discussed here—thermometers, multimeters, and pressure tools—represent foundational measurement technology proven effective across thousands of global facilities. Combined with disciplined measurement protocols and consistent data analysis, these tools deliver the early warning systems that keep equipment running reliably.
Start with your three most critical systems. Establish baseline measurements this month. Record monthly data for the next quarter. By then, you'll see the patterns that indicate where your next equipment stress will develop—and you'll have time to address it before failure costs skyrocket. That's the power of systematic Measurement & Detection in predictive maintenance.