Understanding HVAC Measurement & Detection for Your Plant
As a plant manager, you know that HVAC systems represent a significant operational investment. Measurement & Detection systems form the backbone of effective HVAC management—they tell you what's happening inside your heating, cooling, and distribution systems in real time. Without proper measurement, you're essentially flying blind when it comes to system performance, energy consumption, and potential failures.
At 3G Electric, our 35+ years of experience distributing industrial equipment across Southeast Asia has shown us that plants investing in comprehensive measurement and detection systems see measurable improvements in uptime, energy efficiency, and maintenance cost control. The key is understanding what to measure, where to measure it, and how to act on the data you collect.
HVAC measurement & detection encompasses three primary domains: pressure monitoring, temperature measurement, and airflow detection. Each plays a critical role in system optimization and early fault detection. This guide provides practical, actionable strategies for implementing these systems in your facility.
Section 1: Pressure Monitoring in HVAC Systems
Why Pressure Measurement Matters
Pressure is the most telling indicator of HVAC system health. Abnormal pressure readings reveal compressor issues, refrigerant leaks, blockages, and expansion tank problems before they cascade into catastrophic failures. For plant managers, pressure monitoring provides early warning and helps justify maintenance interventions to senior management.
Two pressure points demand your attention: system line pressure (in refrigeration circuits) and differential pressure (across filters, coils, and ducts). Each tells a different story about system condition.
Implementing Pressure Measurement & Detection
Start with analog pressure gauges at critical measurement points. The Preciman Stainless Steel Vertical Pressure Gauge D63 0/+40Mbar is ideal for low-pressure HVAC monitoring in tropical Southeast Asian environments. Its stainless steel construction withstands humidity and temperature fluctuations, while the ±1.6% accuracy ensures reliable readings. Mount this gauge on expansion tanks, receiver tanks, and distribution manifolds.
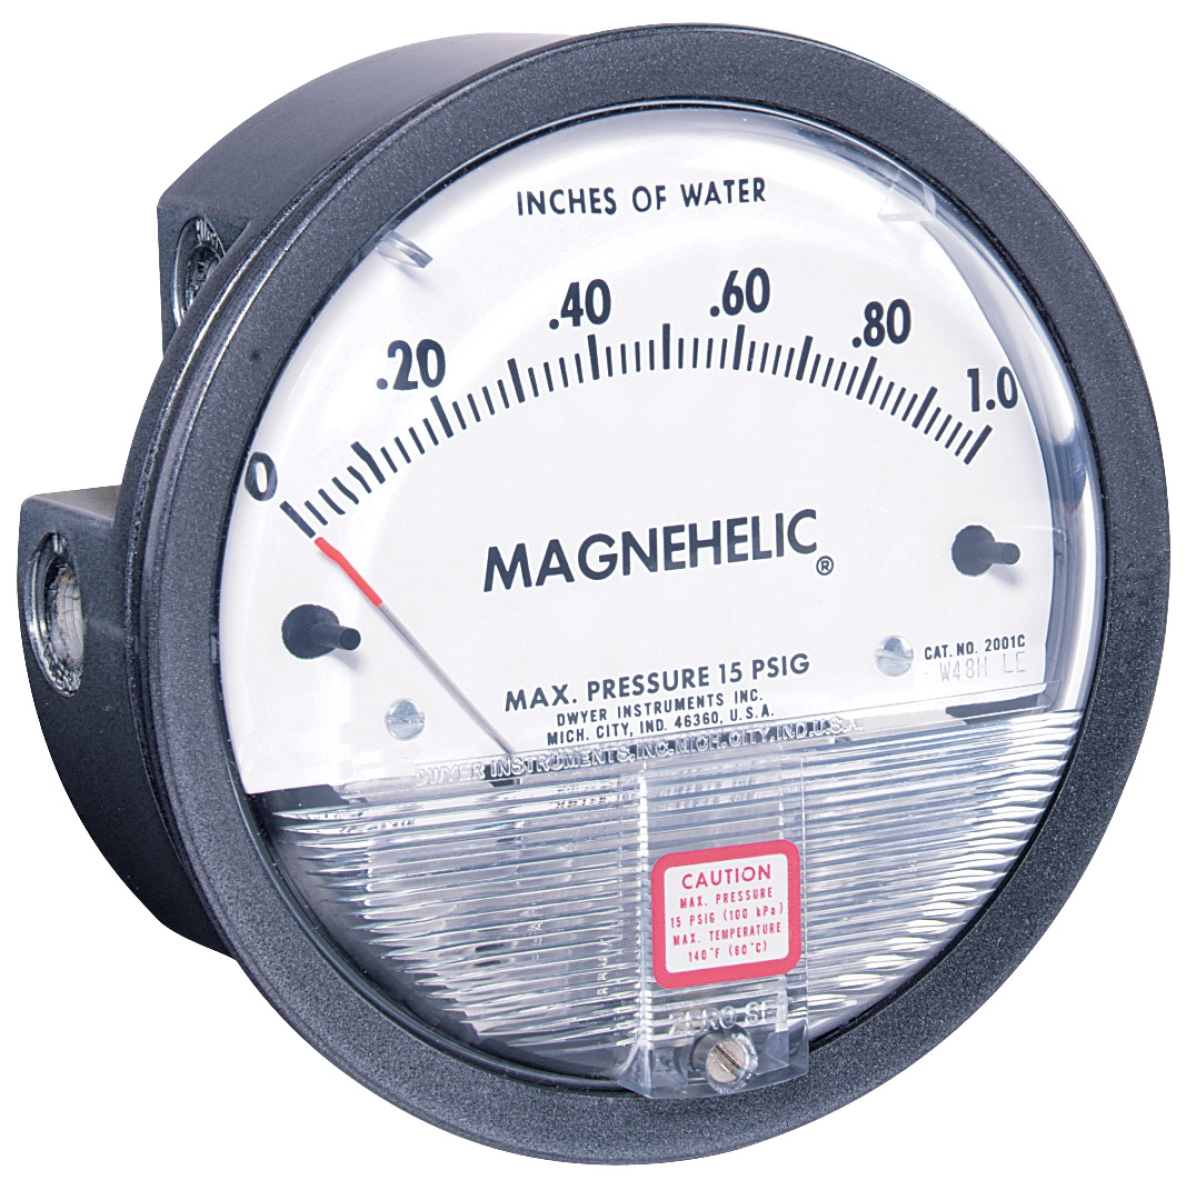
For differential pressure monitoring across filters and coils, deploy the Dwyer Transmitter 616KD-13V-TC. This differential pressure transmitter measures pressure drops from 0–1 IN W.C with exceptional precision. Connect it across your air filter housing and cooling coils. When differential pressure exceeds setpoints, you know filters need replacement or coils require cleaning—before airflow degradation affects comfort or efficiency.
Maintenance Considerations
Inspect gauge connections monthly for leaks. In high-humidity coastal areas (common across Southeast Asia), apply protective grease around G1/4 connection points. Document baseline pressure readings during normal operation, then establish alarm thresholds at ±15% variance. When readings drift beyond these parameters, investigate immediately.
Section 2: Temperature Measurement & Detection in HVAC Circuits
Temperature as a Diagnostic Tool
Temperature measurement serves dual purposes: it confirms system operation and reveals inefficiencies. Refrigerant supply temperature tells you if your compressor is working correctly. Return air temperature confirms proper heat exchange. Temperature differentials across coils indicate fouling or refrigerant issues.
For plant managers, temperature data justifies energy bills and explains capacity limitations. When stakeholders question why the system can't maintain setpoint during peak demand, temperature profiles prove the system is operating at design limits.
Installing Temperature Probes
The Dwyer Probe AVG PT100 OHM RTD is your core temperature measurement tool. This PT100 RTD probe offers ±0.6% accuracy across the -35.5 to +115.5°C range—covering everything from cold refrigerant lines to hot discharge air. The flexible copper capillary allows easy installation in existing piping without major modifications.
Install probes at five strategic locations:
- Compressor discharge – confirms refrigerant pressure and temperature correlation
- Expansion tank inlet – detects superheat issues
- Return air duct – tracks indoor conditions
- Supply air duct – confirms heating/cooling capacity
- Outdoor intake – contextualizes system load
Connect these probes to a centralized monitoring system or building management system (BMS). Record 15-minute averages to identify gradual performance degradation that daily observations might miss.
Interpreting Temperature Data
Establish baseline temperature profiles during commissioning under standard operating conditions. Southeast Asian plants should account for seasonal variations—cooling loads peak during 10 AM to 4 PM in most locations, creating predictable temperature patterns. When actual performance deviates from baseline, investigate systematically:
If discharge temperature rises 5°C above baseline without load increase, check for refrigerant undercharge or compressor valve leakage. If supply air temperature won't reach setpoint, verify coil fouling or pump failure. Temperature diagnostics eliminate guesswork.
Section 3: Airflow Detection and Flow Measurement
Why Flow Measurement Matters
You can have perfect pressure and temperature, but if air isn't flowing properly through ducts and rooms, comfort and efficiency suffer. Flow measurement tells you if your distribution system is balanced, if dampers are stuck, and if ductwork is obstructed.
Many plant managers neglect flow measurement because it's not as intuitive as pressure or temperature. That's a missed opportunity—flow problems are often the first sign of system degradation and represent easy wins for energy savings.
Installing Flow Probes
The Dwyer Metal Average Flow Probe MAFS-16 measures static and total pressure across 16 cm of probe length, providing reliable flow measurement in main air distribution trunks. Install this probe in your primary supply duct, at least three duct diameters downstream of the air handler to ensure stable flow patterns.
Connect the probe's static and total pressure ports to a differential pressure transmitter or directly to your monitoring system. Calculate volume flow rate using the measured dynamic pressure and duct cross-sectional area.
Balancing and Optimization
With flow data, you can identify distribution imbalances. If flow drops 20% from baseline, investigate ductwork blockages, damper positions, and filter condition. Use flow measurement to commission VAV (variable air volume) systems properly—ensure each zone receives its design airflow before reducing fan speed.
For SEA plant managers, this is critical: many facilities over-size distribution fans to guarantee adequate flow to the most remote zones, wasting energy. Flow probes reveal whether this over-sizing is necessary and guide damper adjustment for optimal balance.
Section 4: Expansion Tank Monitoring and Pressure Maintenance
Critical Infrastructure Often Overlooked
Expansion tanks absorb volume changes in closed-loop heating systems and prevent pressure spikes. Yet many plants neglect expansion tank maintenance until catastrophic failure occurs. Proper measurement & detection prevents this.
Preventive Tank Pressure Monitoring
Expansion tank pre-charge pressure must match system design specifications—typically 0.9–1.2 bar for most heating loops. Over time, tank bladders deteriorate and nitrogen pre-charge leaks out. Monthly pressure checks prevent failures.
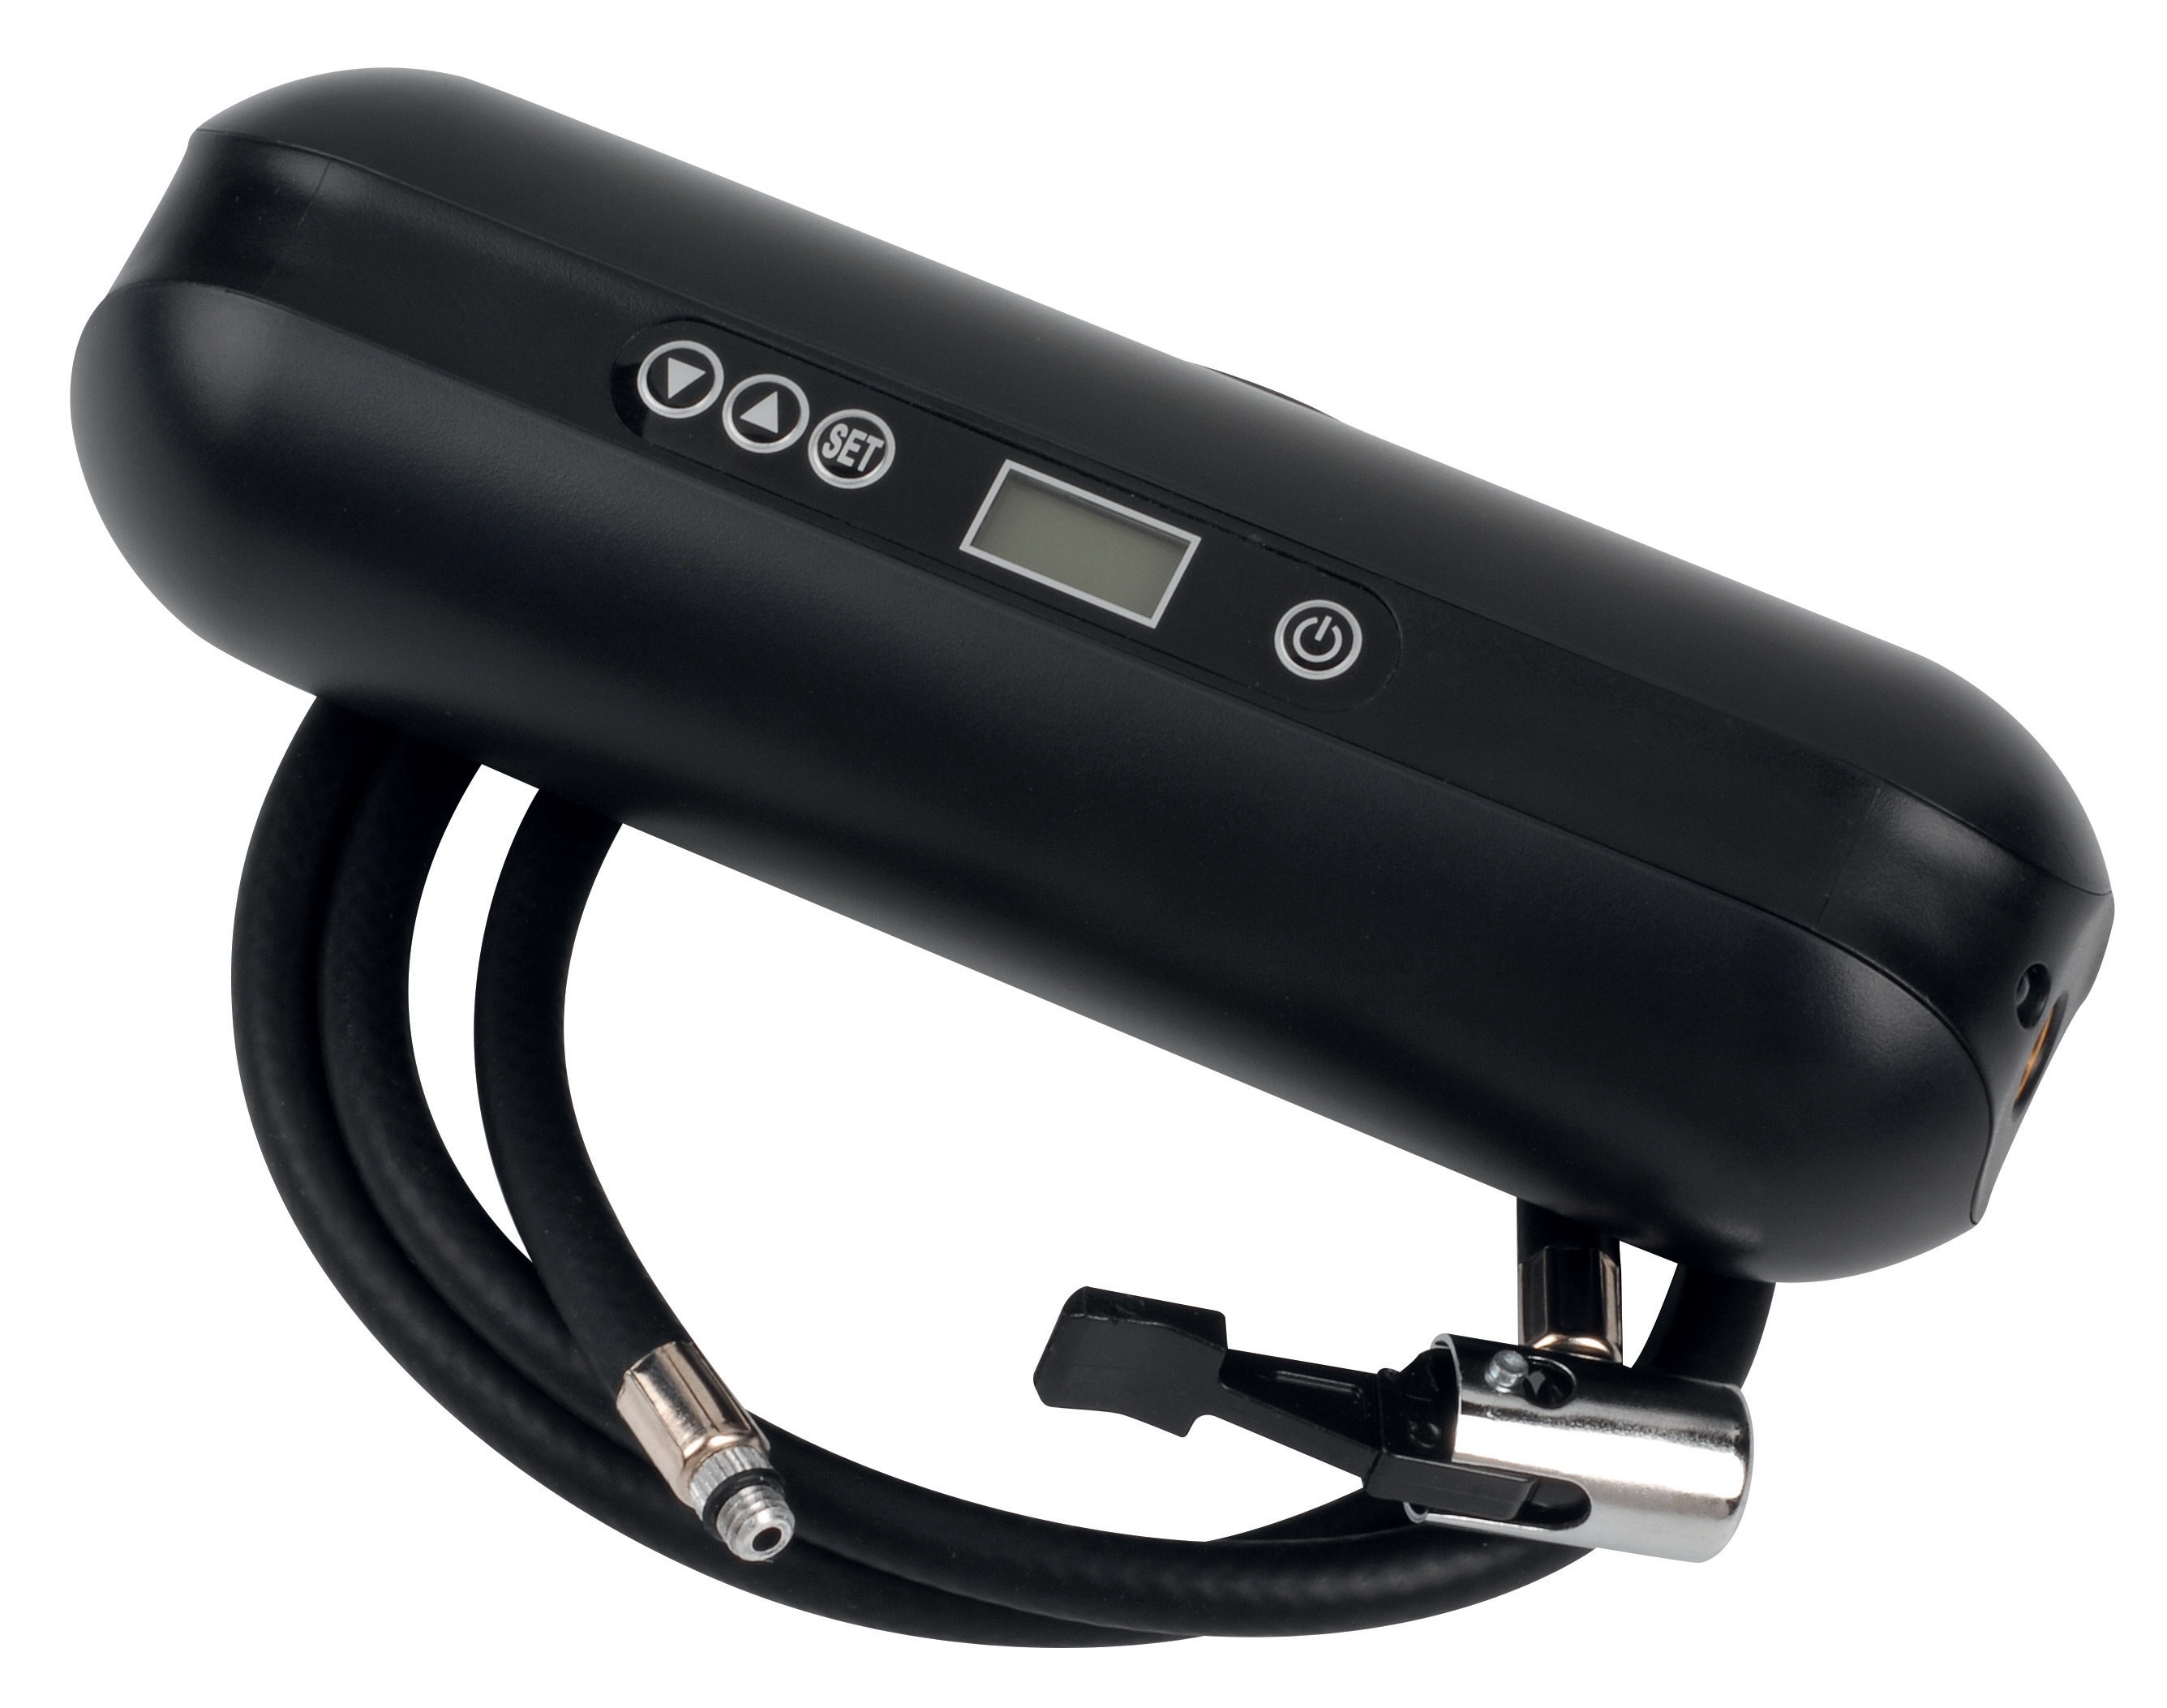
The CBM Expansion Tank Inflator Battery 2000 mAH enables in-situ pressure measurement and adjustment. This device operates across -20 to 60°C (exceeding typical Southeast Asian extremes) and supports multiple pressure units for international operations. Use it to check tank pre-charge pressure monthly, especially in coastal areas where salt air accelerates corrosion.
Procedure: Isolate the expansion tank, release system pressure, and use the CBM inflator to measure tank pressure. Record readings in a maintenance log. If pressure has dropped below minimum, reinflate to specification. This 10-minute monthly task prevents expensive tank replacement and heating system downtime.
Integrating Measurement & Detection into Daily Operations
Establishing Baselines
Your first step is commissioning documentation. During the first month of operation (or immediately if your systems are already running), record temperature, pressure, and flow readings under various operating conditions. Establish baseline profiles for:
- Peak cooling demand (typically 2 PM on the hottest day of the month)
- Part-load operation (50% design load)
- Minimum load (early morning, cold weather)
- Maintenance conditions (system off, ambient only)
These baselines become your diagnostic reference. When actual performance deviates, you immediately know something has changed.
Creating Action Thresholds
With baseline data, establish alarm thresholds:
- Alert threshold: 10% variance from baseline—investigate at next scheduled maintenance
- Warning threshold: 15% variance—dispatch technician within 48 hours
- Critical threshold: 25% variance—emergency response, shut down if necessary
These thresholds protect your facility without triggering false alarms that erode credibility with maintenance teams and senior management.
Documentation and Trending
Implement a simple spreadsheet or BMS dashboard to track readings. Monthly trending reveals gradual degradation that daily readings miss. A 2% monthly pressure rise in a refrigeration system indicates slow refrigerant leakage—addressable before catastrophic failure. A 1°C monthly rise in discharge temperature signals compressor wear—worth discussing with your refrigeration contractor before capacity drops significantly.
SEA plant managers benefit particularly from trending because seasonal variations are dramatic. Your cooling system's baseline in July differs substantially from January. Tracking monthly trends accounts for this seasonality and identifies true anomalies.
Practical Tips for Southeast Asian Operations
Environmental Considerations
Southeast Asia's high humidity, temperature extremes, and salt-air exposure near coastal facilities demand robust equipment. Choose stainless steel gauges and probes over standard brass fittings. Protect transmitter connections with cable conduit and waterproof connectors. Inspect all measurement points quarterly for corrosion.
Multi-Site Coordination
If you manage multiple facilities, standardize on the same measurement equipment. This simplifies troubleshooting, reduces spare parts inventory, and allows technicians to transfer between sites without retraining. 3G Electric's 35+ years distributing across Southeast Asia means we maintain stock of these proven products at regional locations, ensuring fast replacement when needed.
Integration with Preventive Maintenance
Tie measurement data directly to your PM schedule. If filter differential pressure approaches limits, schedule cleaning at next PM window. If compressor discharge temperature trends upward, add compressor valve inspection to next maintenance cycle. This data-driven approach transforms maintenance from reactive (fixing failures) to predictive (preventing failures).
Conclusion
Measurement & Detection systems don't run themselves—they require thoughtful implementation, baseline establishment, and consistent monitoring. But the investment pays substantial dividends: extended equipment life, improved energy efficiency, reduced emergency repairs, and justified capital investment to senior management.
Start with pressure monitoring (highest ROI for most facilities), then add temperature measurement, and finally implement flow detection. This phased approach lets you build competency and justify costs through documented efficiency gains.
For equipment selection and technical support, 3G Electric's team brings three decades of experience implementing these systems across Southeast Asian plants. We understand regional challenges, have inventory at multiple locations, and can provide technical guidance tailored to your specific HVAC configuration.