Understanding Measurement & Detection in Energy Efficiency Audits
Measurement and Detection represents far more than data collection—it's the foundation of intelligent energy management. For plant managers responsible for Southeast Asian facilities, systematic measurement and detection enables you to quantify energy waste, pinpoint inefficiencies, and justify capital improvements with concrete data.
Energy audits without proper measurement and detection are essentially guesswork. You might suspect equipment is underperforming or systems are misaligned, but without baseline data and continuous monitoring, improvement initiatives lack credibility and ROI justification. With 35+ years of experience distributing industrial equipment, 3G Electric has observed that facilities applying rigorous measurement and detection protocols reduce energy consumption by 15-25% within the first operational year.
The challenge in Southeast Asia's tropical and subtropical climate is that seasonal variation, humidity fluctuations, and equipment cycling patterns create complex baselines. Proper measurement and detection transforms this complexity into actionable insight.
Establishing Energy Baselines Through Comprehensive Measurement
Your first step is establishing accurate baseline measurements across all major systems. This requires strategic placement of detection instruments that capture both average conditions and peak performance scenarios.
Pressure System Baselines
Pressure fluctuations directly correlate to energy consumption. The Preciman Stainless Manometer Green with 0/+160 mbar range serves as an essential baseline tool for low-pressure gas and fluid systems. Position these instruments at key points: system inlet, after filters, across heat exchangers, and at terminal units. In Southeast Asian facilities, we recommend baseline measurements across 24-hour cycles to capture morning startup transients, peak operational hours, and evening load reduction patterns.
For higher-pressure systems serving pumps and compressors, the Preciman Green ABS Pressure Gauge D80 (0/+10 bar) provides reliable measurement across industrial process lines. Record baseline readings weekly for the first month, then bi-weekly for three months. This establishes seasonal patterns essential for accurate energy analysis.
Temperature Monitoring Protocols
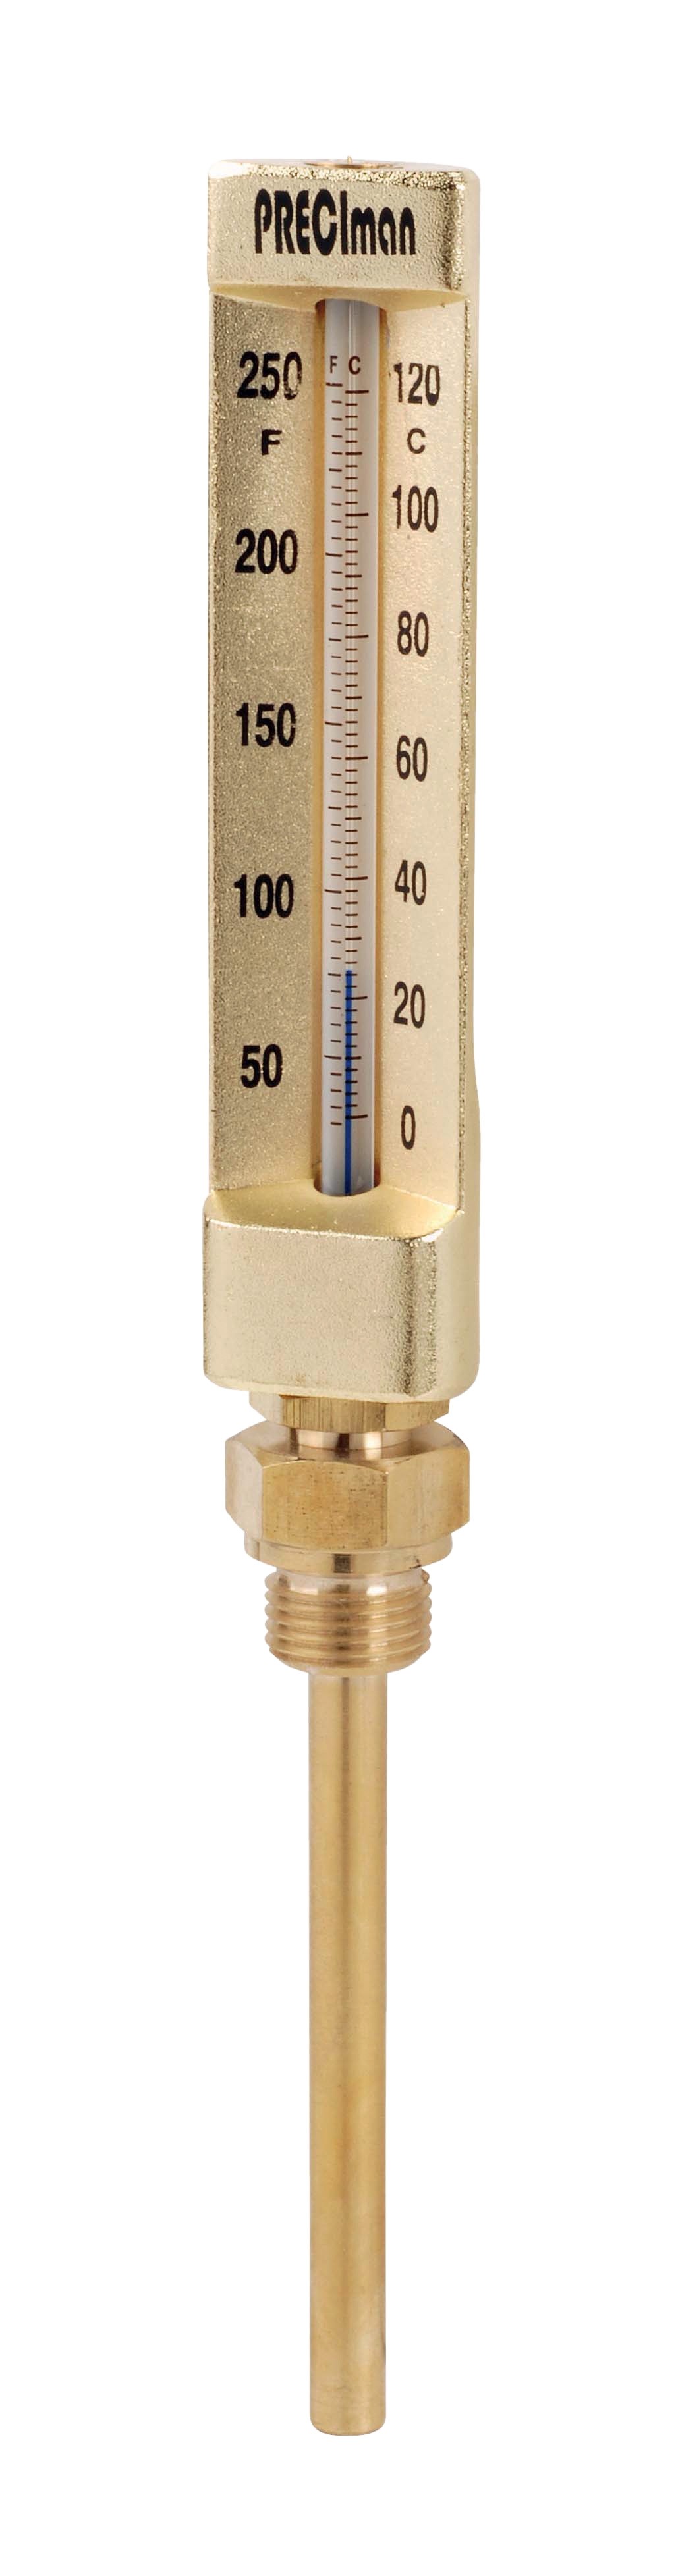
Temperature control represents 40-60% of facility energy consumption in most Southeast Asian plants. The Preciman Industrial Thermometer with 0/+120°C immersion probe enables direct measurement at critical control points: chilled water supply and return, hot water circuits, process fluid systems, and ambient sensing locations.
Establish temperature baselines at:
- Chiller outlet and return points
- Air handling unit supply and return
- Process equipment inlet and outlet
- Outdoor air intake and conditioned space
Compare actual operating temperatures against design setpoints. Deviations of 2-3°C often indicate control valve problems, sensor drift, or insulation degradation—all quantifiable energy waste sources.
Differential Pressure Measurement
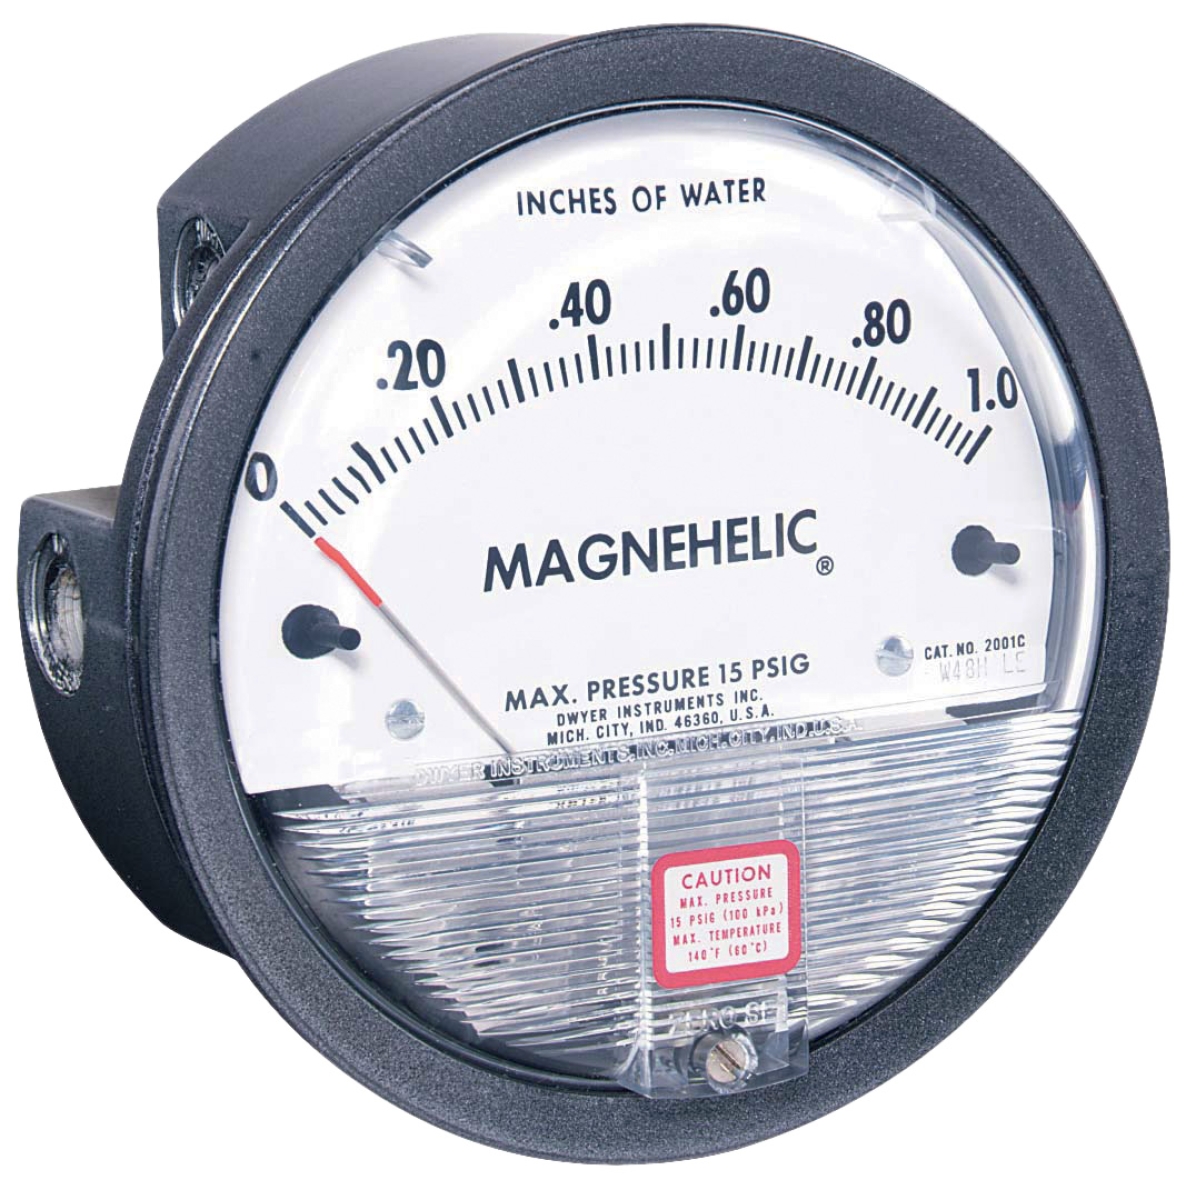
Differential pressure across filters and coils directly indicates energy penalty. The Dwyer Magnehelic Differential Pressure Gauge (0–8 kPa) precisely measures these critical points. High differential pressures signal dirty filters consuming excessive fan energy, while low pressures may indicate leakage or bypass problems.
Establish baseline differential pressure readings at:
- Air filters (target: <50 Pa clean, <100 Pa replacement threshold)
- Cooling coils (target: varies by design, typically 20-40 Pa)
- Heating coils
- Ductwork sections
Increasing differential pressure trends forecast maintenance needs and energy waste weeks in advance.
Detecting Efficiency Degradation and Waste Patterns
Once baselines are established, detection becomes the ongoing process of identifying deviations that signal efficiency losses. Systematic detection requires regular measurement intervals and clear deviation thresholds.
Identifying Control System Drift
In Southeast Asian facilities operating 24/7 across variable load conditions, sensor drift and control valve stiction are common degradation patterns. By comparing measured values against design setpoints monthly:
- Temperature sensors drifting 1-2°C cause unnecessary cooling or heating cycles, wasting 3-5% of energy
- Pressure sensors misaligned by 0.5 bar trigger inappropriate compressor or pump modulation
- Differential pressure switches sticking cause equipment to override controls or limp-mode operation
Detection protocols should flag measurements exceeding design parameters by 5%. For example, if chilled water return temperature consistently runs 3°C above design setpoint despite stable load, your detection process identifies potential valve leakage, sensor error, or control algorithm problems.
Monitoring Equipment Degradation Signatures
Different equipment types show characteristic degradation patterns detectable through systematic measurement:
Pump and Compressor Performance: Increasing discharge pressure at constant flow rates indicates wear in internals. The Preciman Green ABS Pressure Gauge detects this trend when discharge pressure climbs despite stable load. Monthly trend analysis identifies when equipment requires maintenance before catastrophic failure increases energy consumption 30-40%.
Heat Exchanger Fouling: Widening temperature differential across heat exchangers without corresponding pressure rise indicates fouling. Monthly temperature readings using Preciman Industrial Thermometer probes at inlet and outlet detect this 6-8 weeks before significant performance loss occurs.
Filter Saturation: Differential pressure trending across filters predicts replacement requirements 2-3 weeks ahead, preventing energy waste from operating plugged filters.
Real-Time Indoor Air Quality Detection
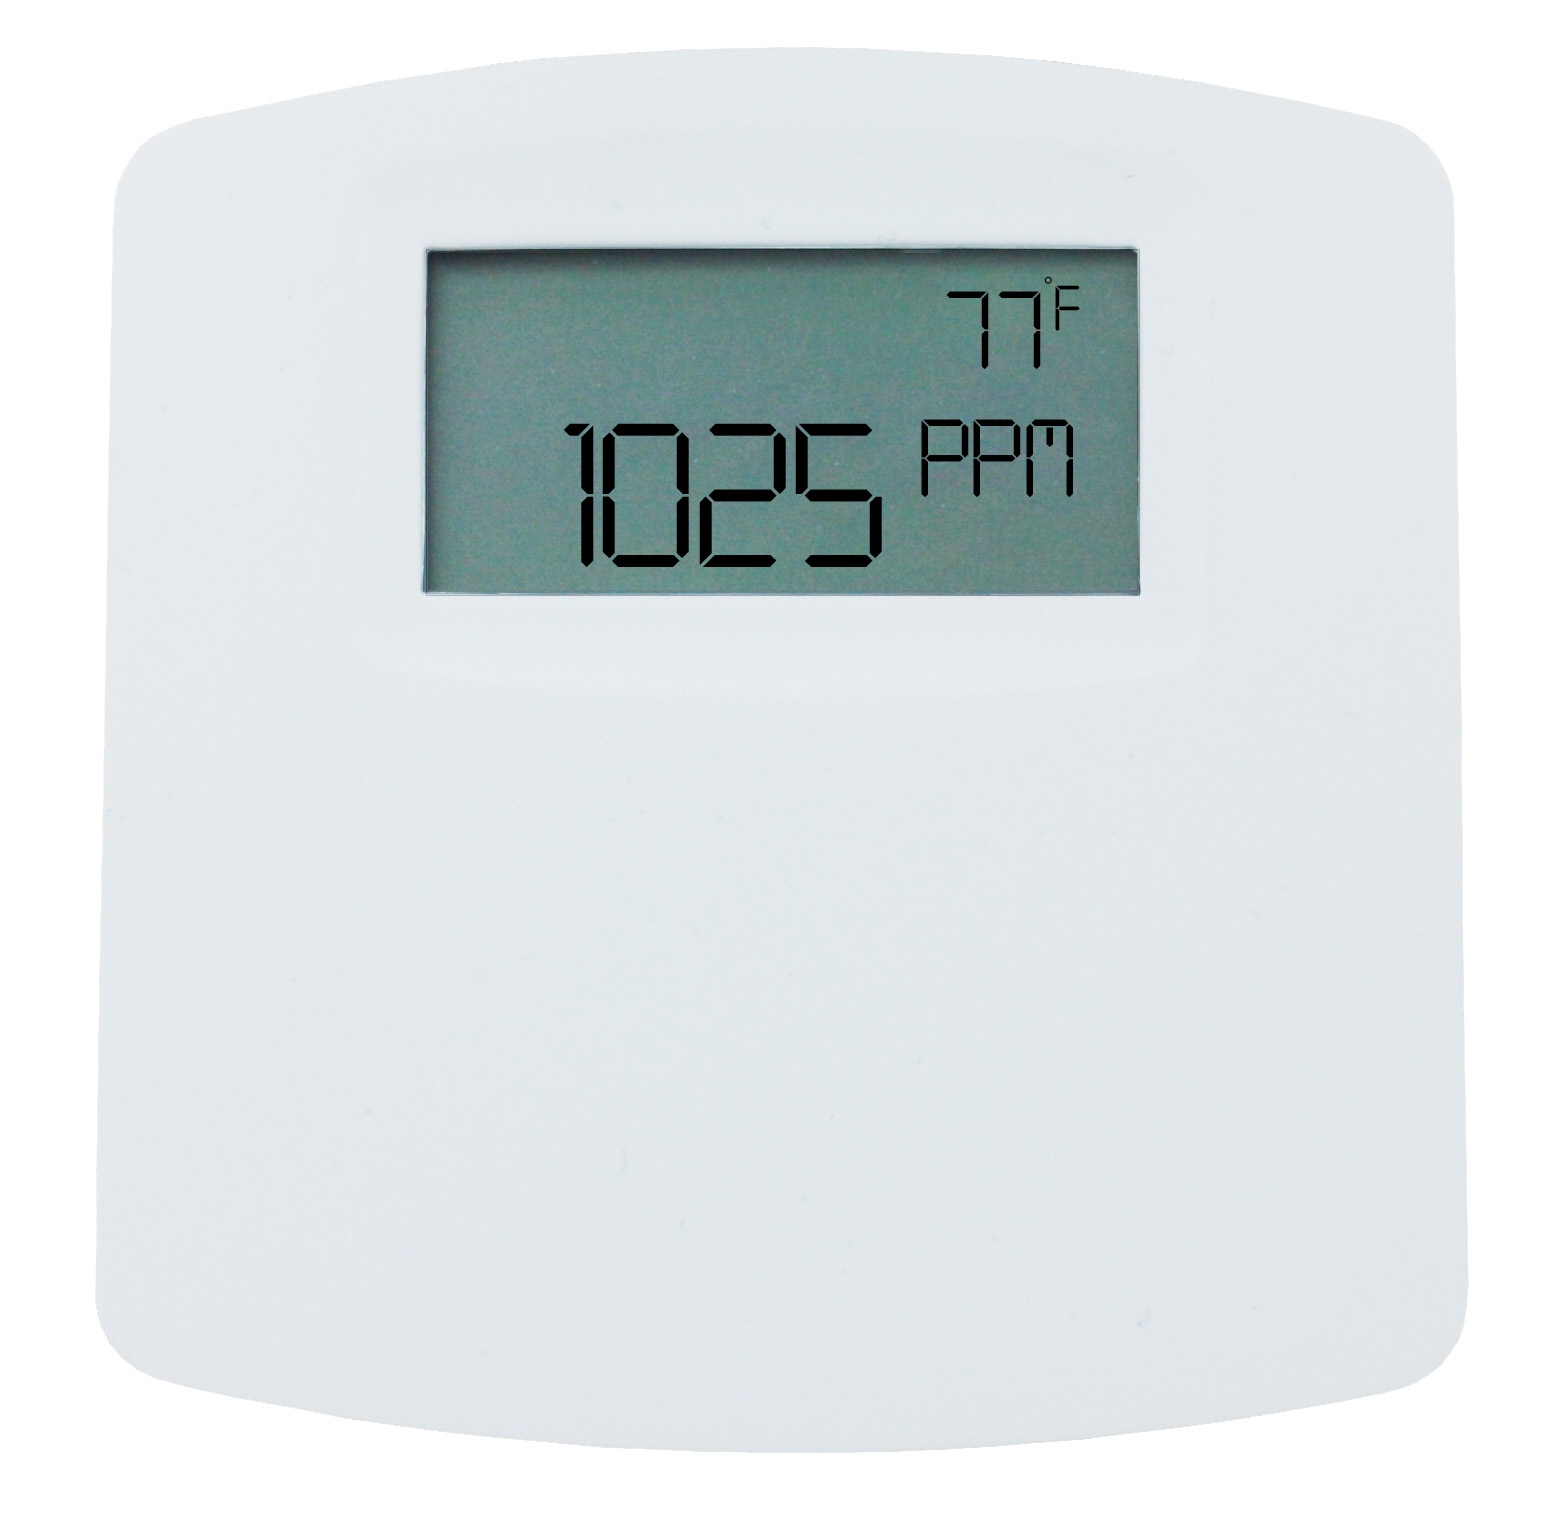
Southeast Asian facilities—particularly food processing, manufacturing, and cleanroom operations—increasingly require air quality monitoring. The Dwyer CO2 Detector CDTA-5N000 with Modbus communication provides continuous detection of indoor air quality conditions. Elevated CO2 levels (above 1000 ppm) indicate inadequate outdoor air intake, forcing HVAC systems to overcool or overheat occupied spaces to maintain comfort with stale air.
Systematic CO2 detection reveals:
- Inadequate air changes per hour (AHU undersized or malfunctioning)
- Economizer damper stuck in minimum position
- Demand-controlled ventilation (DCV) sensors failing
- Supply fan underperforming
Correcting CO2-driven energy waste typically saves 8-12% of HVAC energy within one month.
Converting Detection Data Into Continuous Improvement Actions
Measurement and detection only create value when converted into systematic action. Plant managers must establish processes for translating detected anomalies into prioritized improvements.
Monthly Energy Audit Reporting
Develop a standardized monthly report capturing:
- All pressure, temperature, and differential pressure measurements
- Comparison against design baselines
- Identification of parameters exceeding acceptable deviation thresholds
- Energy penalty estimation (in kWh and currency)
- Recommended corrective actions
- Implementation priority and estimated payback period
Southeast Asian temperature and humidity extremes stress measurement instruments. Establish quarterly calibration checks against reference standards. Instruments drifting more than 2% require recalibration or replacement—measurement accuracy directly determines audit credibility.
Equipment Maintenance Triggered by Detection Data
Link measurement and detection systems directly to preventive maintenance scheduling. When differential pressure trends indicate filter replacement needed, or temperature deviations suggest sensor replacement, create automated maintenance work orders. This transforms detection from reporting activity into operational discipline.
Stakeholder Communication Through Data Visualization
Plant managers who successfully reduce energy costs consistently display measurement and detection data in highly visible formats:
- Digital dashboards showing current vs. baseline conditions
- Trending charts highlighting seasonal patterns
- Cost-impact displays showing energy savings from recent improvements
- Equipment health indicators derived from detection thresholds
This transparency builds organizational momentum for continuous efficiency improvement.
Selecting Measurement & Detection Instruments for Your Facility
Choosing appropriate instruments requires matching your facility's operational complexity, climate conditions, and efficiency objectives.
For HVAC-Dominant Facilities: Prioritize differential pressure measurement across filters and coils (Magnehelic gauge), temperature baselines at all chiller, boiler, and terminal points (Preciman thermometers), and optional CO2 detection for demand-controlled ventilation optimization.
For Pump and Compressor Systems: Emphasize pressure trending across discharge and return lines (Preciman pressure gauges), differential measurement across system components, and temperature monitoring at inlet and outlet to detect efficiency degradation.
For Mixed-Load Facilities: Implement tiered measurement starting with high-impact systems (chillers, boilers, major compressors), then expand to secondary systems as budgets allow.
3G Electric's 35+ years as an industrial equipment distributor means we've supplied measurement and detection instruments to thousands of Southeast Asian facilities. Our experience shows that systematic measurement and detection generates positive ROI within 12-18 months through energy savings alone, with additional benefits from improved equipment reliability and extended service life.
Start your energy efficiency audit with baseline measurements this month. Within six months of disciplined detection protocols, your facility will have the data foundation for confident, high-impact energy management decisions.