Understanding Maintenance & Service Diagnostics in Industrial Operations
Maintenance & Service excellence depends on early problem detection. Unlike reactive repair approaches, diagnostic-focused maintenance identifies equipment degradation before catastrophic failure occurs. Industrial professionals managing high-pressure systems, pumps, and control infrastructure need reliable tools to measure system performance in real time.
With over 35 years of experience distributing industrial equipment globally, 3G Electric understands that diagnostic capability separates efficient operations from crisis-driven maintenance cycles. This article compares three critical diagnostic approaches: pressure monitoring systems, pump performance assessment, and control valve functionality testing.
Pressure Monitoring and Real-Time System Diagnostics
Differential Pressure Measurement for System Health
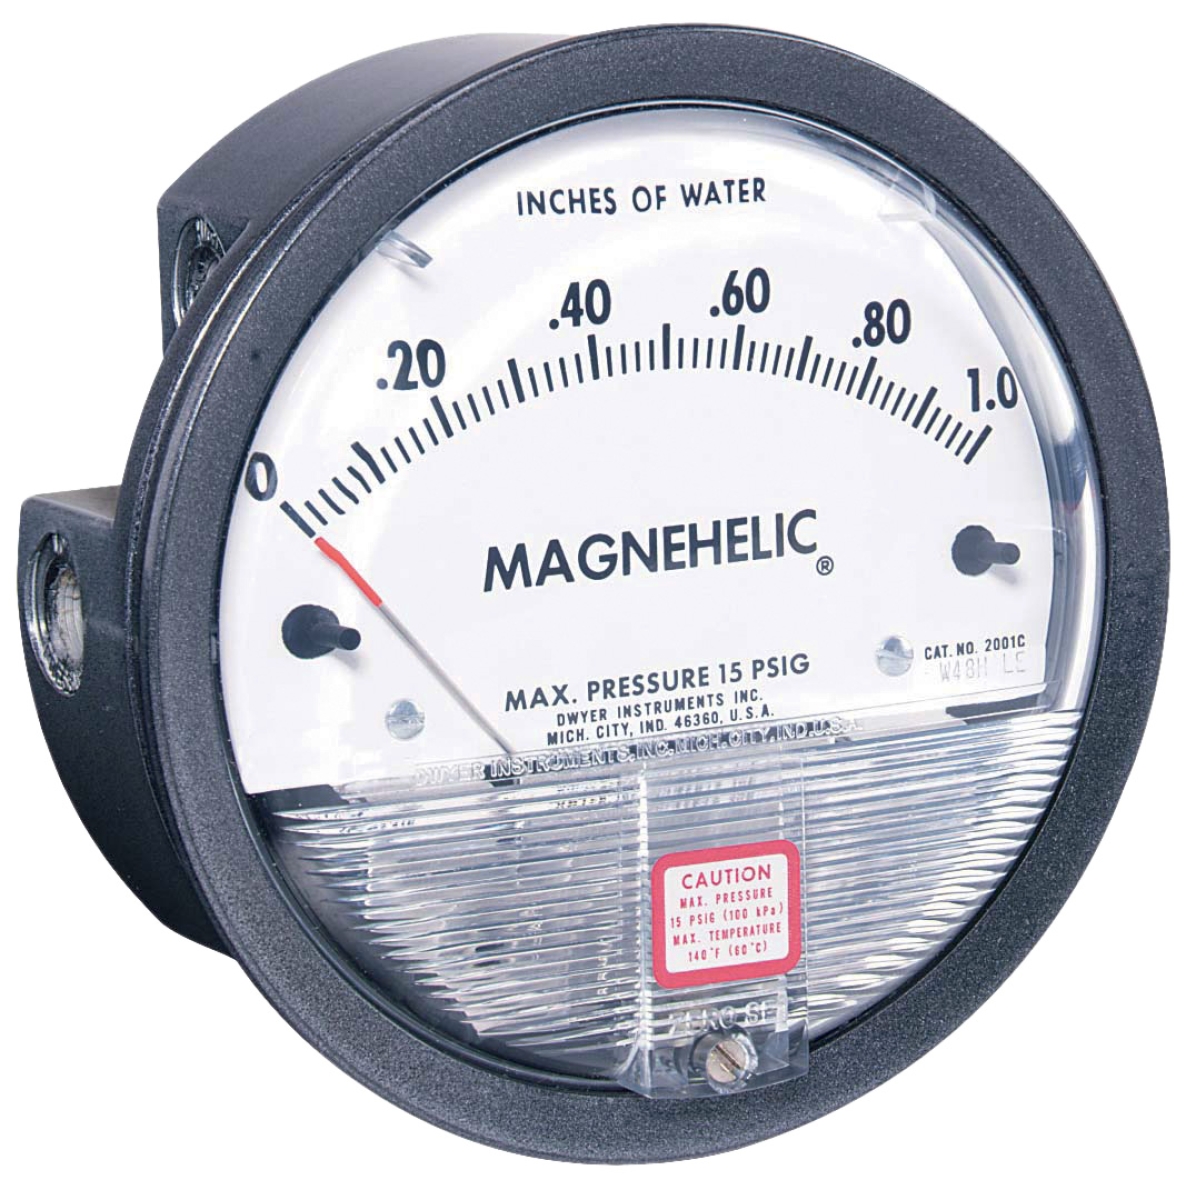
Pressure monitoring forms the foundation of predictive maintenance. The Dwyer Magnehelic differential pressure gauge measures pressure differentials from 0–8 kPa with a 4-inch dial display, making it suitable for HVAC systems, cleanroom monitoring, and industrial ventilation applications. This analog measurement tool provides immediate visual feedback without electronic dependency.
Key diagnostic advantages of differential pressure monitoring:
- Filter Condition Assessment: Rising differential pressure across filters indicates clogging before complete blockage
- System Imbalance Detection: Pressure differentials between circuits reveal circulation problems
- Component Wear Indication: Gradual pressure changes signal bearing wear or seal degradation in pumps
- Temperature Compensation: The Dwyer gauge operates across -6.67–60°C, covering industrial environments from cold storage to high-heat facilities
Industrial professionals use differential pressure trends to schedule maintenance during planned downtime rather than emergency shutdowns. A 10% monthly increase in filter differential pressure suggests replacement within 2–3 weeks, allowing procurement of spare filters before system failure.
Pressure Threshold Monitoring in Multi-Zone Systems
Complex industrial facilities often feature multiple pressure zones. Monitoring each zone independently prevents masking problems in single circuits. For example, a manufacturing plant with 15 pressure-controlled processes can identify which circuit requires attention by comparing zone-specific readings.
Differential pressure gauges with multiple connection points allow technicians to:
- Compare upstream and downstream pressures to isolate blockages
- Monitor pressure drops across individual components
- Validate control valve response across system load changes
- Document baseline readings for long-term trend analysis
Documentation of pressure readings over 6–12 months establishes performance baselines. When readings deviate 5–15% from baseline, maintenance scheduling becomes data-driven rather than calendar-driven.
Pump Performance Assessment and Capacity Verification
Matching Pump Specifications to Application Demands
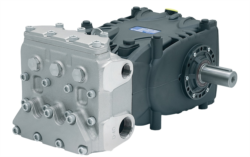
Pump degradation typically progresses through three stages: normal operation, declining efficiency, and failure. Diagnostic maintenance aims to catch pumps in stage two. The Pratissoli KF30 pump delivers 106 L/min flow at 200 bar pressure with 40 kW power consumption, representing mid-range industrial capacity.
Key diagnostic parameters for pump assessment:
- Flow Rate Decline: Measuring actual output against nameplate specifications identifies cavitation or internal wear
- Pressure Build-up Time: Slower pressure rise indicates bearing wear or internal leakage
- Power Consumption Increase: A 15–25% rise in power draw suggests friction losses from wear
- Noise and Vibration Changes: Audible pitch changes or increased vibration correlate with bearing degradation
Industrial facilities should establish baseline measurements when pumps are new. Flow rate baseline for the KF30 at full throttle might be 106 L/min; after 12 months of operation, a decline to 98–100 L/min suggests beginning wear. At 90 L/min, replacement planning becomes urgent.
Gearbox Integration and Power Transmission Efficiency
The Interpump GEARBOX RS500 transmits 18.5 kW maximum power with a 2.2 transmission ratio, serving as an interface between prime movers and pump assemblies. Diagnostic assessment of gearbox condition reveals whether power loss occurs at the transmission stage or within the pump itself.
Diagnostic checks for gearbox functionality:
- Temperature Monitoring: Gearbox oil temperature should stabilize within 5–10 minutes of operation. Continuous temperature rise beyond 65°C suggests bearing friction or inadequate lubrication
- Fluid Analysis: Sampling gearbox oil for metallic particles reveals internal wear before gear teeth fail
- Vibration Signature Analysis: Different bearing failure modes produce distinct vibration frequencies detectable with portable vibration analyzers
- Efficiency Measurement: Power input vs. pump output comparison isolates transmission losses
When gearbox efficiency drops below 92%, internal degradation has usually advanced significantly. Replacing gearboxes before catastrophic failure prevents collateral damage to pump shafts and bearings.
Control Valve Diagnostics and Response Verification
Solenoid Valve Functionality Testing
The Elektrogas solenoid valve EVRM NA 7 controls gas distribution at DN65 flanges with 600 Mbar pressure rating. Solenoid valves fail in predictable ways; diagnostic testing identifies failure modes before complete malfunction.
Solenoid valve diagnostic procedures:
- Response Time Measurement: Normal engagement occurs within 50–150 milliseconds. Slower response indicates coil degradation or internal sludge
- Seal Leakage Testing: Apply system pressure without electrical activation. Gas flow past the valve seat indicates seal wear requiring replacement
- Coil Insulation Testing: Measure resistance between coil terminals and valve body. Values below 2 megohms suggest moisture ingress or insulation breakdown
- Power Consumption Verification: Rated at 19 W, actual draw above 22–24 W indicates coil resistance degradation from aging
Industrial gas systems benefit from quarterly solenoid testing. A valve passing all tests today might fail within weeks if early-stage degradation is present. Predictive replacement prevents emergency downtime and gas leakage incidents.
Pressure Control Stability Assessment
Control valves must respond proportionally to demand changes. Diagnostic testing involves:
- Step Response Observation: Quickly increase system load and observe how pressure stabilizes. Overshooting (pressure exceeding setpoint by >10%) or hunting (oscillating around setpoint) indicates control instability
- Load Cycling Analysis: Operate the system through multiple load cycles while monitoring pressure. Consistent response proves valve reliability; inconsistent behavior suggests wear
- Hysteresis Measurement: The difference between pressure at valve opening and closing should remain constant. Increasing hysteresis signals internal wear
Spray System Component Diagnostics
Nozzle Wear and Flow Pattern Assessment
The Pratissoli PISTOLA P560*LANCIA 1000 ATEX spray gun operates at 600 bar with 60 L/min capacity for industrial coating and cleaning applications. Spray nozzle diagnostics prevent product quality degradation.
Nozzle assessment methods:
- Pattern Analysis: Compare spray patterns between new and operational nozzles. Asymmetrical or diffuse patterns indicate internal erosion
- Flow Rate Measurement: Collect spray output over 60 seconds and compare to baseline. A 5% flow reduction suggests minor wear; 10%+ indicates replacement
- Pressure Drop Comparison: Nozzles should maintain consistent pressure drop across flow ranges. Increasing pressure drop suggests debris blockage or internal corrosion
- Visual Inspection: Examine nozzle tips with magnification. Surface roughness or visible erosion correlates with spray degradation
Industrial coating operations benefit from scheduled nozzle replacement every 500–1000 operating hours, verified by flow testing rather than calendar date.
Integrated Diagnostic Strategy for Global Operations
Creating a Maintenance Diagnostic Schedule
Effective Maintenance & Service combines multiple diagnostic methods into integrated schedules:
Weekly Diagnostics
- Visual inspection of all components for leaks or damage
- Audible assessment of pump and motor operation
- Manual pressure gauge readings at system entry and exit points
- Differential pressure measurement across filtration
- Solenoid valve response testing
- Gearbox temperature monitoring and trending
- Spray nozzle pattern verification
- Comprehensive pump performance assessment (flow, pressure, power draw)
- Solenoid valve coil insulation and power consumption testing
- Gearbox oil sampling for particle analysis
- Control system response evaluation under load cycling
- Professional vibration analysis of pump and motor bearings
- Fluid analysis of all lubricated components
- Pressure test of all high-pressure connections
- Replacement of suspect components before failure
Documentation and Trend Analysis
Data collection becomes actionable only with systematic tracking. Industrial facilities should maintain logs recording:
- Pressure readings at multiple system points
- Pump flow rate and power consumption
- Gearbox and motor temperatures
- Response times of solenoid-controlled functions
- Service intervals and component replacement dates
Trending this data over 12–24 months reveals degradation patterns. A pump requiring 5% more power annually will demand replacement within 3–4 years. Identifying this trend allows planned replacement during scheduled maintenance windows rather than emergency repair.
Selecting Diagnostic Tools and Equipment
Tool Compatibility with Global Supply Chains
3G Electric's 35+ years distributing industrial equipment globally ensures access to diagnostic tools compatible with major equipment brands. The Dwyer pressure gauge, Interpump gearbox, Praktissoli pump, and Elektrogas valve represent widely-deployed industrial standards, simplifying diagnostic procedures across international operations.
When selecting diagnostic equipment:
- Verify Pressure Ratings: Ensure gauge maximum exceeds system relief pressure by 25%
- Confirm Connection Standards: NPT, BSP, and ISO flanges require correct adapters
- Check Environmental Ratings: IP54-rated valves suit wet industrial environments; temperature ranges must cover facility conditions
- Evaluate Data Integration: Modern facilities prefer devices logging data to cloud platforms for remote monitoring
Cost-Benefit Analysis of Diagnostic Investment
Predictive diagnostic equipment typically costs 2–5% of total system value. A $50,000 high-pressure cleaning system benefits from $1,000–2,500 in pressure gauges, vibration analyzers, and monitoring devices. This investment returns value through:
- Prevented emergency repairs costing 3–10x preventive replacement
- Reduced unplanned downtime (often $500–2,000 per hour in manufacturing)
- Extended component lifespan through early intervention
- Improved safety from failure prevention
Most industrial operations achieve full diagnostic investment payback within 18–24 months through downtime reduction alone.
Best Practices for Diagnostic Maintenance Programs
Training and Skill Development
Diagnostic maintenance requires technician capability. Industrial facilities should:
- Cross-train multiple technicians on diagnostic procedures
- Establish baseline measurements during equipment commissioning
- Document normal operating parameters for all critical systems
- Create decision trees linking diagnostic findings to maintenance actions
Technicians proficient in reading pressure trends, interpreting pump performance data, and evaluating control valve response represent significant competitive advantage. Technical training investments pay dividends through more accurate diagnostics and faster problem resolution.
Remote Monitoring and Digital Integration
Modern industrial operations increasingly integrate diagnostic tools with supervisory control systems. Pressure gauges with electronic outputs and wireless transmission enable remote monitoring, alerting operations teams to developing problems before technician inspection.
For global operations with distributed facilities, remote diagnostics reduce travel costs while improving response time. A facility in Singapore detecting rising gearbox temperatures can initiate replacement orders immediately rather than waiting for routine maintenance windows.
Conclusion
Maintenance & Service effectiveness depends on diagnostic capability. By implementing systematic pressure monitoring with tools like the Dwyer Magnehelic gauge, assessing pump performance against baseline specifications, and testing solenoid valve response, industrial professionals transform maintenance from reactive emergency response to predictive scheduled action.
3G Electric supports global industrial operations with diagnostic-grade components and equipment enabling comprehensive condition assessment. The combination of reliable instrumentation—including the Pratissoli KF30 pump, Interpump gearbox, Elektrogas solenoid valve, and Pratissoli spray gun—with systematic diagnostic procedures maximizes equipment reliability while minimizing operational disruption.