Introduction: Why Diagnostic Testing Matters for Gas Valve Maintenance
Gas Valves & Regulation systems represent critical infrastructure in industrial operations, but their failures often go undetected until they cause operational shutdowns or safety incidents. Unlike other mechanical components, gas valve degradation can be subtle—a small pressure drift, a barely audible leak, or gradual response time degradation that monitoring teams miss during routine inspections.
With over 35 years of experience as a distributor of industrial equipment, 3G Electric has observed that maintenance teams without structured diagnostic protocols experience 40-60% more unplanned downtime related to gas regulation systems. This guide provides maintenance teams with actionable diagnostic testing frameworks, failure analysis methodologies, and preventive maintenance schedules that transform reactive firefighting into proactive reliability management.
Section 1: Diagnostic Testing Protocols for Gas Valve Systems
Pressure Response Testing
The most critical diagnostic for gas regulation systems is pressure response testing—measuring how quickly and accurately your valve responds to pressure changes and load fluctuations. This test reveals whether your valve meets manufacturer specifications and detects the early stages of internal wear.
Equipment Required:
- Digital pressure gauge (0.5% accuracy minimum)
- Test connections with isolation valves
- Flow metering device
- Data logging device or manual recording system
1. Baseline Documentation: Record current inlet pressure, outlet pressure, temperature, and flow rate under normal operating conditions. These become your reference points for future comparisons.
2. Step Load Testing: Gradually increase flow demand in 20% increments while monitoring outlet pressure stability. Document pressure deviation at each step. Acceptable deviation is typically ±5% of setpoint for general applications, though safety-critical systems may require ±2%.
3. Rapid Load Change Test: Close and open downstream isolation valves quickly (simulating sudden demand changes) while recording pressure response time. Compare to manufacturer specifications. Response times exceeding manufacturer ratings by more than 15% indicate internal degradation.
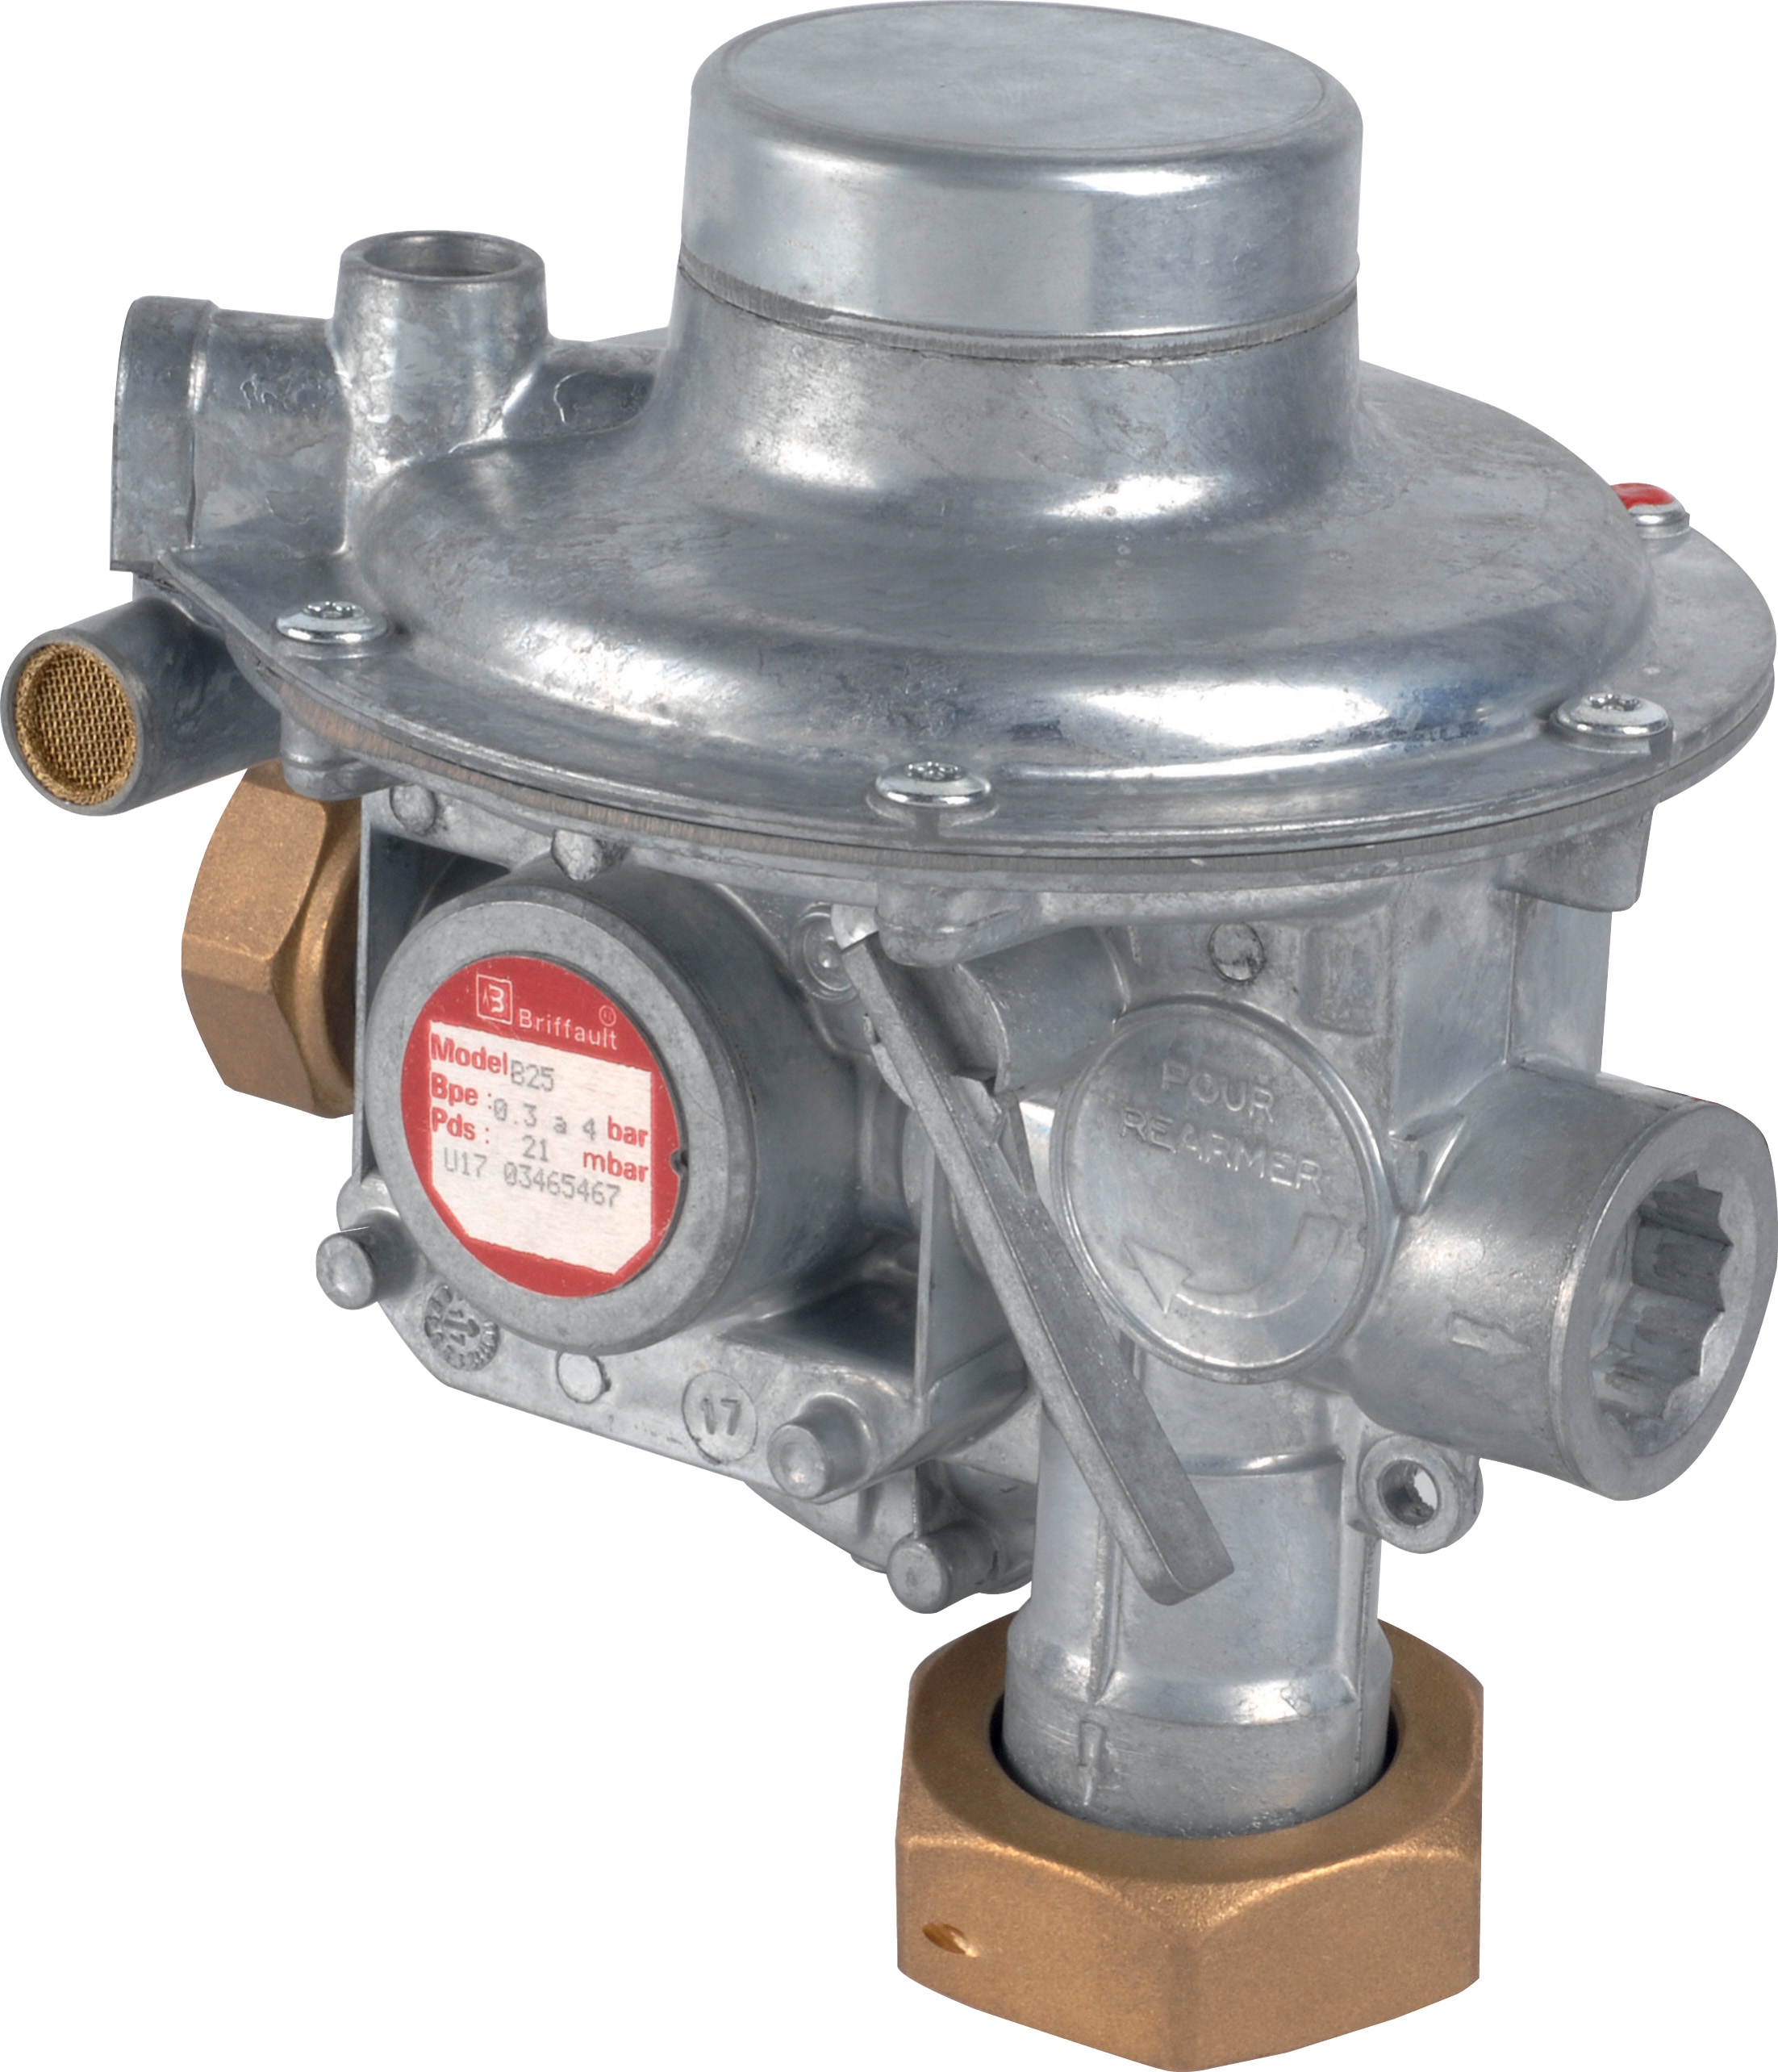
4. Bleed-Off Testing: For regulators with integral relief systems like the Francel B25/37mb pressure regulator, manually bleed off small quantities of gas while monitoring outlet pressure stability. The regulator should maintain setpoint without hunting (continuous oscillation).
Seal Integrity Assessment
Leak detection is the second pillar of gas valve diagnostics. Even small leaks indicate seal degradation that will accelerate without intervention.
Non-Destructive Testing Methods:
- Soap Bubble Test: Apply leak detection solution to all connection points and seals. Bubbling indicates escape paths. This method detects leaks as small as 1 x 10⁻⁴ mbar·L/s.
- Ultrasonic Leak Detection: Use ultrasonic detectors to identify leak locations before they become visible. Particularly useful for high-pressure systems where small leaks create distinctive acoustic signatures.
- Pressure Decay Test: Isolate the valve section, pressurize to operating pressure, and monitor pressure decline over 24 hours. Decay rates above 2% per 24 hours require seal replacement.
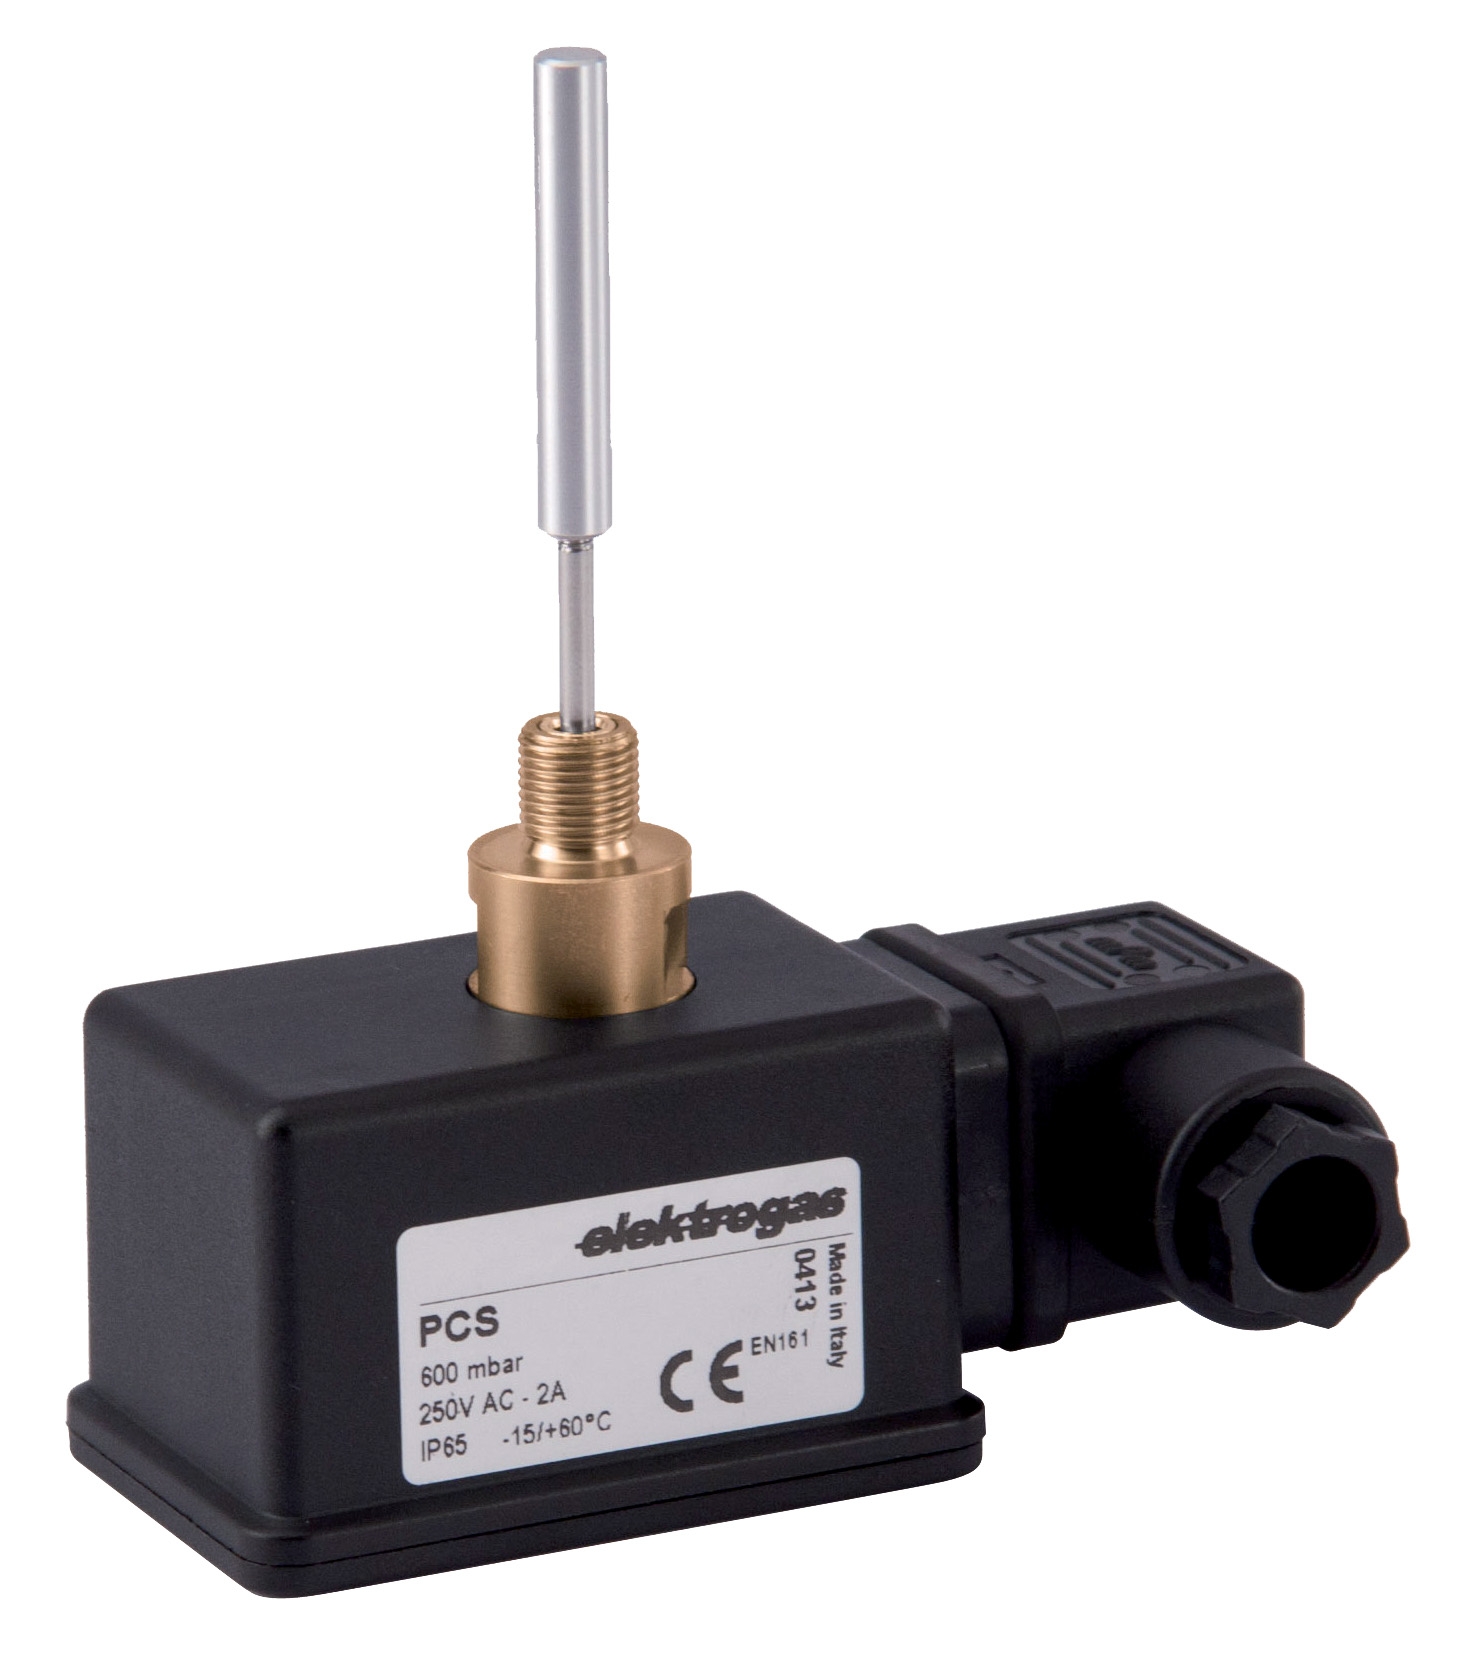
For end-of-stroke contact valves like the Elektrogas VMM 20-25, inspect contact surfaces and sealing surfaces with magnification (10x minimum) for scoring, corrosion, or crystalline deposits that compromise sealing.
Functional Flow Testing
Under actual operating conditions, measure whether your valve delivers specified flow rates at required pressures.
Protocol:
1. Establish baseline flow rate under normal conditions using calibrated flow meter
2. Document temperature, inlet pressure, and outlet pressure simultaneously
3. Calculate flow coefficient (Cv) using formula: Q = Cv × √ΔP, where Q is flow and ΔP is pressure drop
4. Compare calculated Cv to manufacturer specification sheet. Deviations greater than 10% indicate internal restrictions (contamination, scale, or valve damage)
5. Repeat test monthly and trend results in maintenance database
Section 2: Failure Mode Analysis and Root Cause Identification
Common Failure Patterns and Diagnostic Signatures
Hunting or Oscillation
- Symptom: Continuous pressure cycling above and below setpoint
- Root Causes: Undersized valve (insufficient displacement), external feedback tubing too long, contaminated pilot section, or worn seat/poppet surfaces
- Diagnostic Test: Increase valve size if load doesn't require current size; shorten feedback tubing; flush pilot circuit with clean gas
- Prevention: During commissioning, confirm valve Cv rating matches maximum anticipated flow rate with 10% margin
- Symptom: Despite stable inlet pressure and constant flow, outlet pressure gradually increases
- Root Causes: Valve seat erosion from contaminated gas, spring fatigue, or poppet seal degradation
- Diagnostic Test: Perform pressure response test with isolated load; if pressure creeps while isolated, issue is internal to regulator
- Prevention: Install high-efficiency particulate filters upstream; replace internal seals per manufacturer intervals
- Symptom: Small changes in inlet pressure cause disproportionate outlet pressure changes
- Root Causes: Worn pilot system, incorrect adjustment, or undersized main valve spool
- Diagnostic Test: With constant outlet load, vary inlet pressure by ±10% and measure outlet pressure change. Should be <2% change in outlet pressure
- Prevention: Verify pilot pressure feedback line is clean and unobstructed; check adjustment mechanism for mechanical wear
- Symptom: Valve remains stuck in one position despite signal changes
- Root Causes: Contamination particles binding poppet, crystallization of hardened gas residues, or corrosion buildup
- Diagnostic Test: For solenoid-operated systems, verify electrical signal reaches coil with multimeter; for pilot-operated systems, check pilot gas supply; inspect valve body for visible deposits
- Prevention: Use particulate and moisture filters rated for application; establish regular flushing intervals
Pressure Measurement Validation
Many maintenance teams blame valves for regulation problems when pressure gauges themselves are faulty. Before performing extensive diagnostics, verify instrument accuracy:
1. Compare suspect pressure gauge reading against calibrated reference gauge (±0.5% accuracy) at three pressure points (25%, 50%, 75% of maximum scale)
2. If gauge deviation exceeds ±2% of reading, remove gauge for laboratory calibration
3. Replace analog gauges every 3-5 years; digital gauges require recalibration annually
4. Use test gauge blocks for on-site validation instead of replacing suspected gauges immediately
Section 3: Preventive Maintenance Scheduling and Implementation
Maintenance Interval Framework
Preventive maintenance schedules must balance cost against failure risk. This framework establishes intervals based on equipment criticality and operating conditions:
Monthly Visual Inspections (All Gas Valve Installations)
- Check for visible leaks around body seams, connection points, and adjustment mechanisms
- Verify pressure gauges display readings within normal operating range
- Confirm no ice formation, corrosion, or physical damage
- Document any changes in sound or vibration
- For pressure regulators like Francel B25/37mb, inspect the integral safety relief vent for blockages
- Perform pressure response testing (Step 1-3 from Section 1)
- Conduct seal integrity assessment using soap bubble or ultrasonic methods
- Verify downstream system pressures against expected setpoint
- Document all results with date, technician name, and equipment conditions
- Complete flow coefficient testing to establish baseline degradation trends
- Inspect filter elements upstream of regulators; replace if pressure drop exceeds 0.5 bar
- Verify valve adjustment settings with calibrated test equipment
- Flush pilot lines with clean dry nitrogen gas (at least 10 volumes of system internal volume)
- For end-of-stroke contact valves like Elektrogas VMM 20-25, test electrical contacts with multimeter; clean or replace contacts if resistance exceeds 0.1 ohms
- Replace all elastomer seals and soft-seated components regardless of visual condition
- This proactive approach eliminates most unplanned failures; cost of planned maintenance is 60-70% lower than emergency repairs
- Send internal components to authorized service centers for ultrasonic cleaning and inspection
- Replace pressure gauges with recalibrated units
Maintenance Documentation System
Without structured documentation, diagnostic data becomes anecdotal. Implement these tracking methods:
1. Equipment Master File: Create individual file for each gas regulation system containing:
- Equipment tag number and location
- Manufacturer, model, and serial number
- Original installation date and commissioning test results
- Setpoint pressure and flow rating
- Last calibration/service date
2. Monthly Inspection Log: Record date, technician, visual observations, gauge readings, and any corrective actions taken
3. Test Result Tracking: Maintain spreadsheet with pressure response test results, calculated flow coefficients, and pressure deviation trends. Plot trends monthly to identify degradation patterns before failures occur.
4. Spare Parts Inventory: Stock replacement seals, springs, and adjustment components specific to your installed valve models. Having seals available enables responsive maintenance rather than expensive downtime waiting for parts.
Predictive Indicators and Escalation Triggers
Establish clear escalation criteria for maintenance actions:
- Warning Level: Pressure deviation increases from ±2% to ±3%; leak detection shows minor weeping at single connection point
- Action: Schedule maintenance within 30 days; increase monitoring frequency to bi-weekly
- Critical Level: Pressure deviation exceeds ±5%; multiple leak sources detected; response time degradation >20% from baseline; valve unable to maintain setpoint under load changes
- Action: Schedule immediate maintenance; consider temporary redundant regulation or bypass system; establish contingency plan for potential shutdown
- Emergency Level: Uncontrolled pressure rise despite valve operation; complete seal failure; valve mechanical failure
- Action: Isolate system immediately; implement emergency procedures; arrange emergency equipment replacement
Section 4: Advanced Diagnostics and Long-Term Performance Management
Thermal Imaging for Hidden Failures
Thermal imaging reveals internal friction and heat generation indicating problem areas:
1. Establish baseline thermal signature under normal operating conditions using calibrated thermal camera
2. Compare subsequent thermal images to baseline; temperature rises >5°C above surrounding components indicate internal friction
3. Elevated temperatures on valve body (not inlet connection) suggest poppet/seat friction or excessive flow restriction
4. Use thermal data to prioritize maintenance before failures occur
Gas Composition Impact on Valve Performance
Gas composition variations affect valve regulation stability:
- Different gases have different viscosities and densic properties; regulators calibrated for one gas may perform poorly with others
- Before switching applications, test valve performance with intended gas mixture
- For applications involving gas blends, request Cv rating and performance curves for specific blend composition from manufacturers
Contamination Prevention Strategy
Contamination causes 70% of premature valve failures. Establish comprehensive contamination control:
1. Upstream Filtration: Install 10-micron particulate filter with differential pressure indicator; replace when indicator shows clogging
2. Moisture Control: Use desiccant dryers for compressed air systems; maintain dew point at or below -10°C
3. Regular Line Flushing: Quarterly nitrogen purge at 1.2x normal operating pressure removes accumulated deposits
4. Source Gas Quality: If using bottled gases, verify supplier certification for moisture and particulate content
Valve Performance Trending Database
Maintenance teams with performance databases catch failures 2-3 weeks earlier than teams without tracking:
1. Establish baseline metrics within first month of operation
2. Record monthly test results in database with searchable fields (valve ID, pressure, flow, Cv, leak rate)
3. Generate monthly trend reports showing pressure deviation, flow coefficient, and leak rate changes
4. When any metric shows 15% degradation from baseline, schedule maintenance investigation
5. After 12 months, analyze failure patterns across your equipment population to identify common vulnerabilities
Conclusion: From Reactive to Predictive Maintenance
Gas Valves & Regulation systems operate silently until they fail catastrophically. The diagnostic testing protocols, failure analysis frameworks, and preventive maintenance schedules in this guide enable maintenance teams to shift from reactive emergency response to predictive maintenance that prevents failures before they impact operations.
With 35+ years of experience distributing industrial equipment globally, 3G Electric supports maintenance teams through product selection, commissioning support, and technical guidance. When paired with structured diagnostic protocols, quality components like Francel B25/37mb pressure regulators and Elektrogas end-of-stroke contact valves deliver years of reliable service.
Implementing even one diagnostic testing protocol—pressure response testing, seal integrity assessment, or functional flow testing—immediately improves your visibility into system health. Combined with preventive maintenance scheduling and documentation, these practices reduce unplanned downtime by 40-50% while extending equipment life by 30-40%.
Start with equipment serving safety-critical applications, establish baseline test results during the next maintenance window, and build your predictive maintenance program from there. The investment in diagnostic discipline pays dividends through improved reliability and reduced maintenance costs.