Understanding Combustion Efficiency in Your Plant Operations
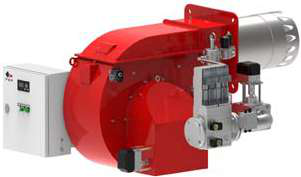
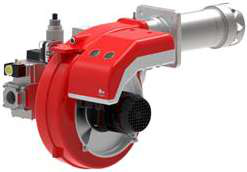
Burners & Combustion represent one of the largest operating expenditures for Singapore industrial facilities. Whether operating two-stage gas burners like the FBR GAS X3/2 CE-LX4 TL Cl. 4 or high-capacity units such as the FBR HI-GAS P1500/M CE TL, understanding true combustion efficiency is critical to profitability.
Combustion efficiency differs from thermal efficiency. Combustion efficiency measures how completely fuel is burned—whether all combustible material is oxidized with minimal unburned hydrocarbons and carbon monoxide in exhaust gases. Thermal efficiency measures how much of that heat energy is transferred to your process. A burner can achieve 99% combustion efficiency but only 75% thermal efficiency if stack losses are high.
For plant managers, the practical metric is overall system efficiency, calculated as: (Heat delivered to process ÷ Energy content of fuel consumed) × 100. Typical industrial burner systems operate at 75-85% overall efficiency. Singapore's humid, high-temperature climate increases cooling losses and air intake challenges, making efficiency monitoring even more critical.
3G Electric's 35+ years distributing industrial equipment across Southeast Asia reveals that most facility inefficiencies stem not from burner design faults, but from drift in operating parameters—air-fuel ratio creep, fouled heat exchangers, and misaligned flame patterns that develop gradually over 12-24 months.
Measuring and Monitoring Combustion Parameters
Effective combustion management requires baseline data collection and continuous monitoring. Plant managers should establish three key measurement protocols:
1. Flue Gas Analysis
Measure exhaust oxygen (O₂), carbon monoxide (CO), and nitrogen oxides (NOx) at steady-state operating conditions. Optimal O₂ levels for natural gas burners range from 3-5%; above 6% indicates excess air (efficiency loss), below 2% risks incomplete combustion and CO formation. Schedule quarterly flue gas testing; weekly monitoring for critical applications.
For the FBR HI-GAS P550/M CE TL and similar modulating burners, test at 50%, 75%, and 100% load to catch efficiency drift across the operating envelope. Singapore's high-humidity environment can shift air density, affecting oxygen readings by ±0.5% seasonally.
2. Fuel Consumption Tracking
Implement differential pressure or volumetric flow measurement on fuel lines. Compare actual consumption (kg/h or m³/h) against burner nameplate specifications. Drift of 5-8% above specification typically indicates nozzle fouling, pump wear, or control valve creep. The FBR HI-GAS P650/M CE TL delivers 60-206 kg/h across its range; deviations from this curve signal maintenance needs.
Track fuel consumption against heat output (thermal energy delivered). Create a consumption-to-output ratio chart; rising ratios indicate efficiency decline requiring investigation.
3. Thermal Duty Measurement
Install inlet and outlet temperature sensors on heat exchangers or process vessels. Calculate thermal energy: Q = (mass flow) × (specific heat capacity) × (temperature difference). Weekly trend analysis reveals degradation patterns—rising fuel consumption for identical thermal duty is the earliest warning sign of efficiency loss.
Practical Tuning and Optimization Strategies
Once baseline measurements establish current efficiency, plant managers can implement targeted improvements:
Air-Fuel Ratio Optimization
The air-fuel ratio is the primary efficiency control point. Too much air (lean) waste energy heating excess air through the stack; too little air (rich) creates incomplete combustion and CO emissions. Use flue gas O₂ as your tuning metric.
For gas burners, start with air damper adjustment at 30% and 100% load. Many facilities operate 1-2% O₂ too high due to age-related valve creep. Reducing O₂ from 5.5% to 4.0% typically improves efficiency by 1-2 percentage points. Perform this tuning with licensed commissioning personnel; improper adjustment risks safety interlock failures.
Load-Based Efficiency Mapping
Plant managers should recognize that most burners operate at highest efficiency in a narrow load band (typically 60-85% capacity). The FBR KN 350/M dual-fuel burner and two-stage units achieve modulation across 4-5:1 turndown ratios, but efficiency curves are non-linear.
Develop a burner efficiency curve: plot O₂ levels (or fuel consumption per thermal unit) against load percentage. Identify the load band where efficiency peaks. Adjust production scheduling where possible to operate burners in this sweet spot. Avoiding low-load operation (under 40% capacity) for extended periods can improve plant-level efficiency by 2-3%.
Heat Exchanger and Flue Gas Path Management
Combustion efficiency means nothing if 20% of heat is lost to scale buildup. Establish a preventive cleaning schedule: annually for clean fuels (natural gas), quarterly for heavy oil applications like the KN 350/M.
Singapore's tropical environment accelerates biological fouling in water-cooled heat exchangers. Monitor pressure drop across exchangers; a 15-20% rise above baseline indicates cleaning is needed. Fouled exchangers reduce thermal efficiency by 5-10% and stress burner controls as they fight rising stack temperatures.
Combustion Air Management
Take air quality for granted at your peril. Burner air intake filters should be inspected monthly in Singapore's humid coastal regions. Wet, salt-laden air intake reduces oxygen availability and increases NOx formation. High-altitude or tropical locations experience lower atmospheric oxygen density.
For high-capacity burners like the FBR HI-GAS P1500/M CE TL, even small intake obstructions cause 2-3% efficiency loss and flame instability. Route combustion air from cool, clean intake points; isolate from exhaust recirculation zones.
Cost-Benefit Analysis and Equipment Selection Decisions
Plant managers must connect efficiency improvements to financial impact. A straightforward ROI calculation:
Annual Fuel Cost Savings = (Current fuel consumption - Optimized consumption) × Fuel cost/unit × Operating hours/year
Example: A facility burning 5,000 m³/month of natural gas at SGD 0.85/m³ saves SGD 510/month (SGD 6,120/year) from a 1% efficiency improvement. Tuning labor and instrumentation cost SGD 3,000-5,000, yielding 6-month payback.
When evaluating new burners, efficiency is a procurement multiplier. A unit delivering 2% higher efficiency than competitor models often justifies 8-12% higher capital cost over a 10-year lifecycle. 3G Electric's distributor relationships across Southeast Asia allow access to FBR's modular burner portfolio—from compact two-stage units like the FBR GAS X3/2 CE-LX4 (23-174 kW) to industrial-scale HI-GAS series (2,325-6,395 kW)—enabling right-sizing for your exact duty cycle rather than oversizing for worst-case.
Burner oversizing—common in legacy installations—forces operation in low-efficiency zones. Rationalizing to correctly sized equipment improves efficiency 3-5% while reducing control stress and wear.
Implementation Roadmap for Singapore Plant Managers
Month 1-2: Establish Baseline
- Commission flue gas analysis; record O₂, CO, NOx, stack temperature
- Measure fuel consumption and thermal output
- Document ambient conditions (temperature, humidity)
- Calculate current overall efficiency
- Compare measurements to burner specifications
- Inspect heat exchanger for fouling
- Review maintenance logs for patterns (frequent control resets, nozzle cleaning frequency)
- Identify operational constraints (load profile, scheduling rigidity)
- Engage licensed commissioning technician
- Adjust air-fuel ratio targeting optimal O₂ band
- Clean heat exchangers if needed
- Verify flame stability and safety interlocks post-tuning
- Perform monthly thermal efficiency calculations
- Quarterly flue gas analysis
- Adjust operational scheduling to favor high-efficiency load band
- Budget for preventive heat exchanger cleaning
Plant managers implementing this structured approach typically achieve 2-4% efficiency gains within 90 days, with minimal capital investment and immediate bottom-line impact.