
Understanding Hydraulic and Pneumatic System Pressure Fundamentals
Hydraulic and pneumatic systems form the backbone of manufacturing, food processing, semiconductor production, and heavy machinery operations throughout Singapore. These systems operate under significant pressure—often ranging from 7 bar in pneumatic lines to 280+ bar in hydraulic circuits—making accurate Measurement & Detection not just a maintenance convenience but a safety requirement.
When pressure deviates from design specifications, it signals underlying problems: failing actuators, worn pump components, blocked filtration systems, or micro-leaks that compound into major failures. Your maintenance team's ability to detect these anomalies early determines whether you experience planned maintenance (cost-controlled) or emergency shutdowns (cost-explosive).
With over 35 years of experience distributing industrial equipment to Singapore's manufacturing sector, 3G Electric understands that maintenance teams need instruments that deliver reliability in harsh shop-floor conditions. Pressure measurement isn't theoretical—it's the diagnostic language your equipment speaks, and you must become fluent.
Establishing Your Baseline Pressure Profile
Before you can detect abnormalities, you must know what "normal" looks like for each system under your care. This baseline-building process is where many maintenance teams fail to invest adequate time, only to chase false alarms later.
Step 1: Document System Design Specifications
Start with original equipment manufacturer (OEM) documentation for every hydraulic and pneumatic system. Record:
- Pump discharge pressure (idle and loaded)
- Actuator line pressures under full load
- Return line backpressure tolerances
- Pilot pressure requirements for directional control valves
- Pressure switch setpoints and differentials
This documentation becomes your diagnostic reference. Without it, you're diagnosing blind.
Step 2: Install Primary Measurement Points
Identify critical measurement locations:
- Pump discharge: Captures overall system health and pump degradation
- Actuator supply lines: Detects flow restrictions and valve wear
- Return/tank lines: Monitors system backpressure and filtration efficiency
- Pilot pressure lines: Indicates control valve integrity
For systems without permanent gauge ports, use quick-disconnect test couplers to enable non-invasive pressure checks. This prevents contamination and allows repeated measurements without system interruption.
The Preciman Manometer ABS vert D80 0/+16bar G1/2 is ideal for field verification of pneumatic system pressures and serves as your primary portable baseline-establishment tool. Its 80 mm dial and ±2.5% accuracy eliminate guesswork when recording initial system pressures. The glycerin-filled design handles vibration and fluctuation common in active production environments without needle flutter.
Step 3: Record Environmental Context
Pressure readings don't exist in isolation. Document:
- Ambient temperature (affects fluid viscosity and pressure gauge response)
- Load conditions (full production vs. partial vs. idle)
- System run time since startup
- Ambient humidity (relevant for pneumatic systems using compressed air with water vapor)
This context prevents false positives. A 5% pressure drop in a hydraulic system at startup versus steady-state operation is normal; the same drop after the system has been running for 4 hours signals potential problems.
Real-Time Monitoring and Pressure-Based Fault Detection
Once baselines are established, continuous Measurement & Detection becomes your early warning system. The goal is catching failures at Stage 1 (minor degradation) rather than Stage 4 (catastrophic breakdown).
Implementing Pressure Transmitters for Continuous Data
For critical systems, temporary portable instruments don't suffice. The Dwyer Transmitter 629-05-CH-P2-E5-S1 provides continuous 4-20 mA output that integrates with your facility's SCADA or data logging systems. This transmitter's 0.5% accuracy and IP65 protection suit Singapore's humid industrial environment.
Installing transmitters at key pressure points allows you to:
- Log pressure trends over hours, days, and weeks
- Detect gradual degradation trends invisible to point-in-time measurements
- Set automated alerts when pressure exceeds or falls below acceptable bands
- Generate diagnostic reports showing pressure behavior before failures occur
Rising System Pressure Without Load Increase: This typically indicates:
- Flow restrictive failure: Blocked return line filters, kinked hoses, or stuck directional control spools
- Pump cavitation: Air ingestion into pump inlet causing erratic discharge pressure
- Relief valve drift: Valve setpoint creeping upward due to internal erosion or contamination
Response: Isolate and inspect return filtration first (easiest), then check pump inlet for air leaks. Relief valve diagnostics should be performed only after eliminating these simpler possibilities.
Declining System Pressure Under Constant Load: This indicates:
- Internal pump leakage: Worn pistons, swashplate, or cylinder wall allowing bypass
- Actuator seal degradation: Cross-port leakage within cylinders or motors
- Control valve erosion: Poppets or spools worn, allowing uncontrolled bypass flow
- Hose rupture or micro-leak: Detectable as declining pressure despite system running
Response: Monitor flow from system return tank or use the Dwyer Medium flow metal probe MAFS-20 to measure actual fluid flow at the pump discharge. A pressure drop accompanied by lower-than-expected flow narrows the fault location significantly. Flow matched to pressure confirms pump capacity; excess flow with low pressure confirms internal leakage.
Erratic Pressure Fluctuation: This indicates:
- Pump cavitation (most common): Air entering pump inlet
- Load-sensing system oscillation: Compensator hunting for equilibrium
- Contaminated pilot pressure: Dirt particles causing intermittent valve spool stiction
Response: Check pump inlet area for loose fittings, cracked hose sections, or low tank level first. These cavitation sources are simple to address. If present, bleed air from pump and retest. If fluctuation persists, contamination is likely—inspect pilot filter condition and consider fluid sampling for particle analysis.
Pressure Switch Selection and Safety Monitoring
Measurement & Detection isn't limited to gauges and transmitters. Pressure switches provide automatic safety functions and can alert maintenance teams to abnormal conditions before they escalate.
Understanding Pressure Switch Setpoints
The Dwyer Pressure switch DXW-11-153-4 exemplifies proper pressure switch selection for pneumatic systems. This unit features:
- Setpoint range of 0.41–0.55 bar: Appropriate for pneumatic pilot circuits and low-pressure applications
- Differential range of 3.46–5.17 bar: The reset point, preventing chatter on marginal pressure conditions
- IP65 protection and 5 A @ 125/250 VAC rating: Suitable for controlling solenoid pilot valves and indicating circuits
When selecting pressure switches, follow these principles:
1. Match Setpoint to System Operating Pressure
Select a switch with its setpoint 10–15% above normal operating pressure. This prevents false trips from normal load transients while catching genuine pressure abnormalities.
2. Verify Differential (Hysteresis)
The differential is the pressure drop required to reset the switch. A 5 bar differential prevents constant make-break cycling when pressure hovers near setpoint. Too large a differential delays reset; too small causes rapid switching.
3. Confirm Electrical Rating Matches Load
Pressure switches driving solenoid valves must have sufficient amp rating. The DXW-11-153-4's 5 A rating handles most pneumatic solenoid coils; larger hydraulic systems may require industrial-rated switches rated for 10+ amps.
Functional Safety Application: Low-Pressure Shutdown
Implement a pressure switch monitoring pump discharge pressure. If pressure falls below 80% of normal operating value (indicating pump failure or major leak), trigger an automatic shutdown to prevent damage from running without load feedback. This is particularly critical for variable displacement pumps that can overheat if operated unloaded.
Test pressure switch setpoints quarterly by:
1. Isolating the monitored system or creating a test circuit
2. Gradually increasing pressure using a pump or hand pressure device
3. Recording the pressure at which the switch trips
4. Slowly reducing pressure and recording reset pressure
5. Documenting deviation from manufacturer specifications; drift > ±5% indicates calibration drift requiring professional recalibration
Temperature-Based Diagnostics for System Condition Assessment
While pressure measurements detect immediate malfunctions, temperature measurements reveal degradation developing over weeks or months. Elevated system temperature indicates:
- Increased internal leakage from worn components
- Friction increasing due to viscosity breakdown
- Heat generation from high bypass flow through relief valves
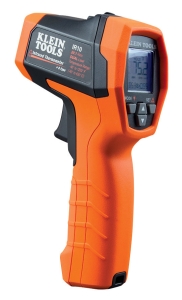
The CBM Infrared thermometer with type K input measures surface temperatures from -40 to 650°C, enabling non-contact thermal diagnostics on hydraulic reservoirs, pump casings, and motor bodies. The 20:1 optical resolution allows measurement of small component areas without contact contamination.
Temperature-Based Diagnostic Protocol
Weekly thermal checks identify developing problems:
1. Reservoir Surface Temperature: Should stabilize 10–15°C above ambient within 30 minutes of system startup. Rising above this target suggests increasing internal losses.
2. Pump Casing Temperature: Measure at pump discharge port area. Excessive temperature (> 80°C) indicates internal leakage or cavitation-induced heating.
3. Motor Case Temperature: For hydraulic motors, measure external case—elevated temperature (> 70°C) indicates internal seal degradation with resulting friction.
4. Cylinder Rod Temperature: Monitor external rod surface. Elevated rod temperature suggests piston seal wear and internal leakage.
Compare weekly readings on the same components at the same system operating conditions. A 5°C increase week-over-week requires investigation. A 15°C increase signals imminent failure and dictates scheduling component replacement during the next planned maintenance window.
Documentation and Trend Analysis for Predictive Maintenance
Measurement & Detection data becomes valuable only when systematically recorded and analyzed. A spreadsheet is superior to memory; a database with trend visualization is superior to spreadsheets.
Essential Data Fields for Every Measurement
- Date and time of measurement
- System or component identifier
- Measurement type (pressure, temperature, flow)
- Actual reading
- Expected range or baseline
- Environmental conditions (ambient temperature, load %, run time)
- Technician name and notes
- Linear trend: Pressure declining 0.5 bar/week indicates slow component degradation; schedule component replacement within 4 weeks
- Exponential trend: Pressure declining 2+ bar/week indicates imminent failure; escalate to immediate scheduled maintenance
- Step change: Sudden 5+ bar pressure drop indicates acute failure (hose rupture, seal blow-out); stop system immediately and diagnose
- Oscillation pattern: Erratic pressure swings indicate cavitation or contamination; filter or air-bleed required before next production run
Shareing pressure and temperature trends with your planning and procurement teams enables proactive spare parts ordering, preventing delays when failures do occur.
Practical Implementation for Singapore Industrial Environments
Singapore's hot, humid climate and 24/7 production schedules present specific Measurement & Detection challenges. Equipment experiences thermal cycling daily; condensation forms in pneumatic lines; salt-air corrosion accelerates sensor deterioration.
Environmental Adaptation Strategies
1. Pressure gauge selection: Glycerin-filled manometers like the Preciman ABS vert D80 resist moisture infiltration and corrosion better than dry gauges. Verify your supplier stocks glycerin-fill replacements for long-term maintainability.
2. Transmitter installation: Mount electronic transmitters away from direct condensation sources. Use cable glands and IP65-rated enclosures to protect connector terminals from humidity.
3. Pneumatic system drying: Implement desiccant dryers on compressed air supplies to prevent water vapor condensation in pilot lines—a primary cause of pressure switch failure in tropical environments.
4. Calibration interval: In corrosive environments, reduce calibration intervals from 12 months to 6 months. Verify your distributor offers onsite calibration services to minimize downtime.
3G Electric's 35+ years serving Singapore's industrial sector means our technical team understands these environmental challenges intimately. When selecting measurement instruments, partner with a distributor who stocks replacement parts locally and offers rapid calibration services, not one requiring international shipping for routine maintenance.
Measurement & Detection is not a one-time installation—it's an ongoing commitment to understanding your equipment's condition through systematic observation and analysis.