Maintenance & Service Diagnostics: A Systematic Approach to High-Pressure System Reliability
Maintenance & Service excellence extends beyond scheduled inspections—it demands a proactive diagnostic mindset that anticipates failure modes before they manifest as costly downtime. For procurement engineers managing complex industrial equipment portfolios across Singapore's demanding manufacturing and processing sectors, understanding the diagnostic principles that govern high-pressure systems is essential to making informed component selection decisions and establishing realistic service budgets.
With over 35 years of experience supplying industrial equipment, 3G Electric has observed that organizations achieving the highest equipment availability rates share a common practice: they treat diagnostic data as critical procurement intelligence. Rather than simply replacing failed components reactively, leading companies use failure patterns to inform future purchasing decisions, warranty negotiations, and preventive service intervals.
This guide bridges the gap between equipment operation and procurement strategy by equipping you with diagnostic frameworks that directly influence component selection, supplier partnerships, and total cost of ownership calculations.
Section 1: Diagnostic Frameworks for Pressure Regulation and Flow Control Systems
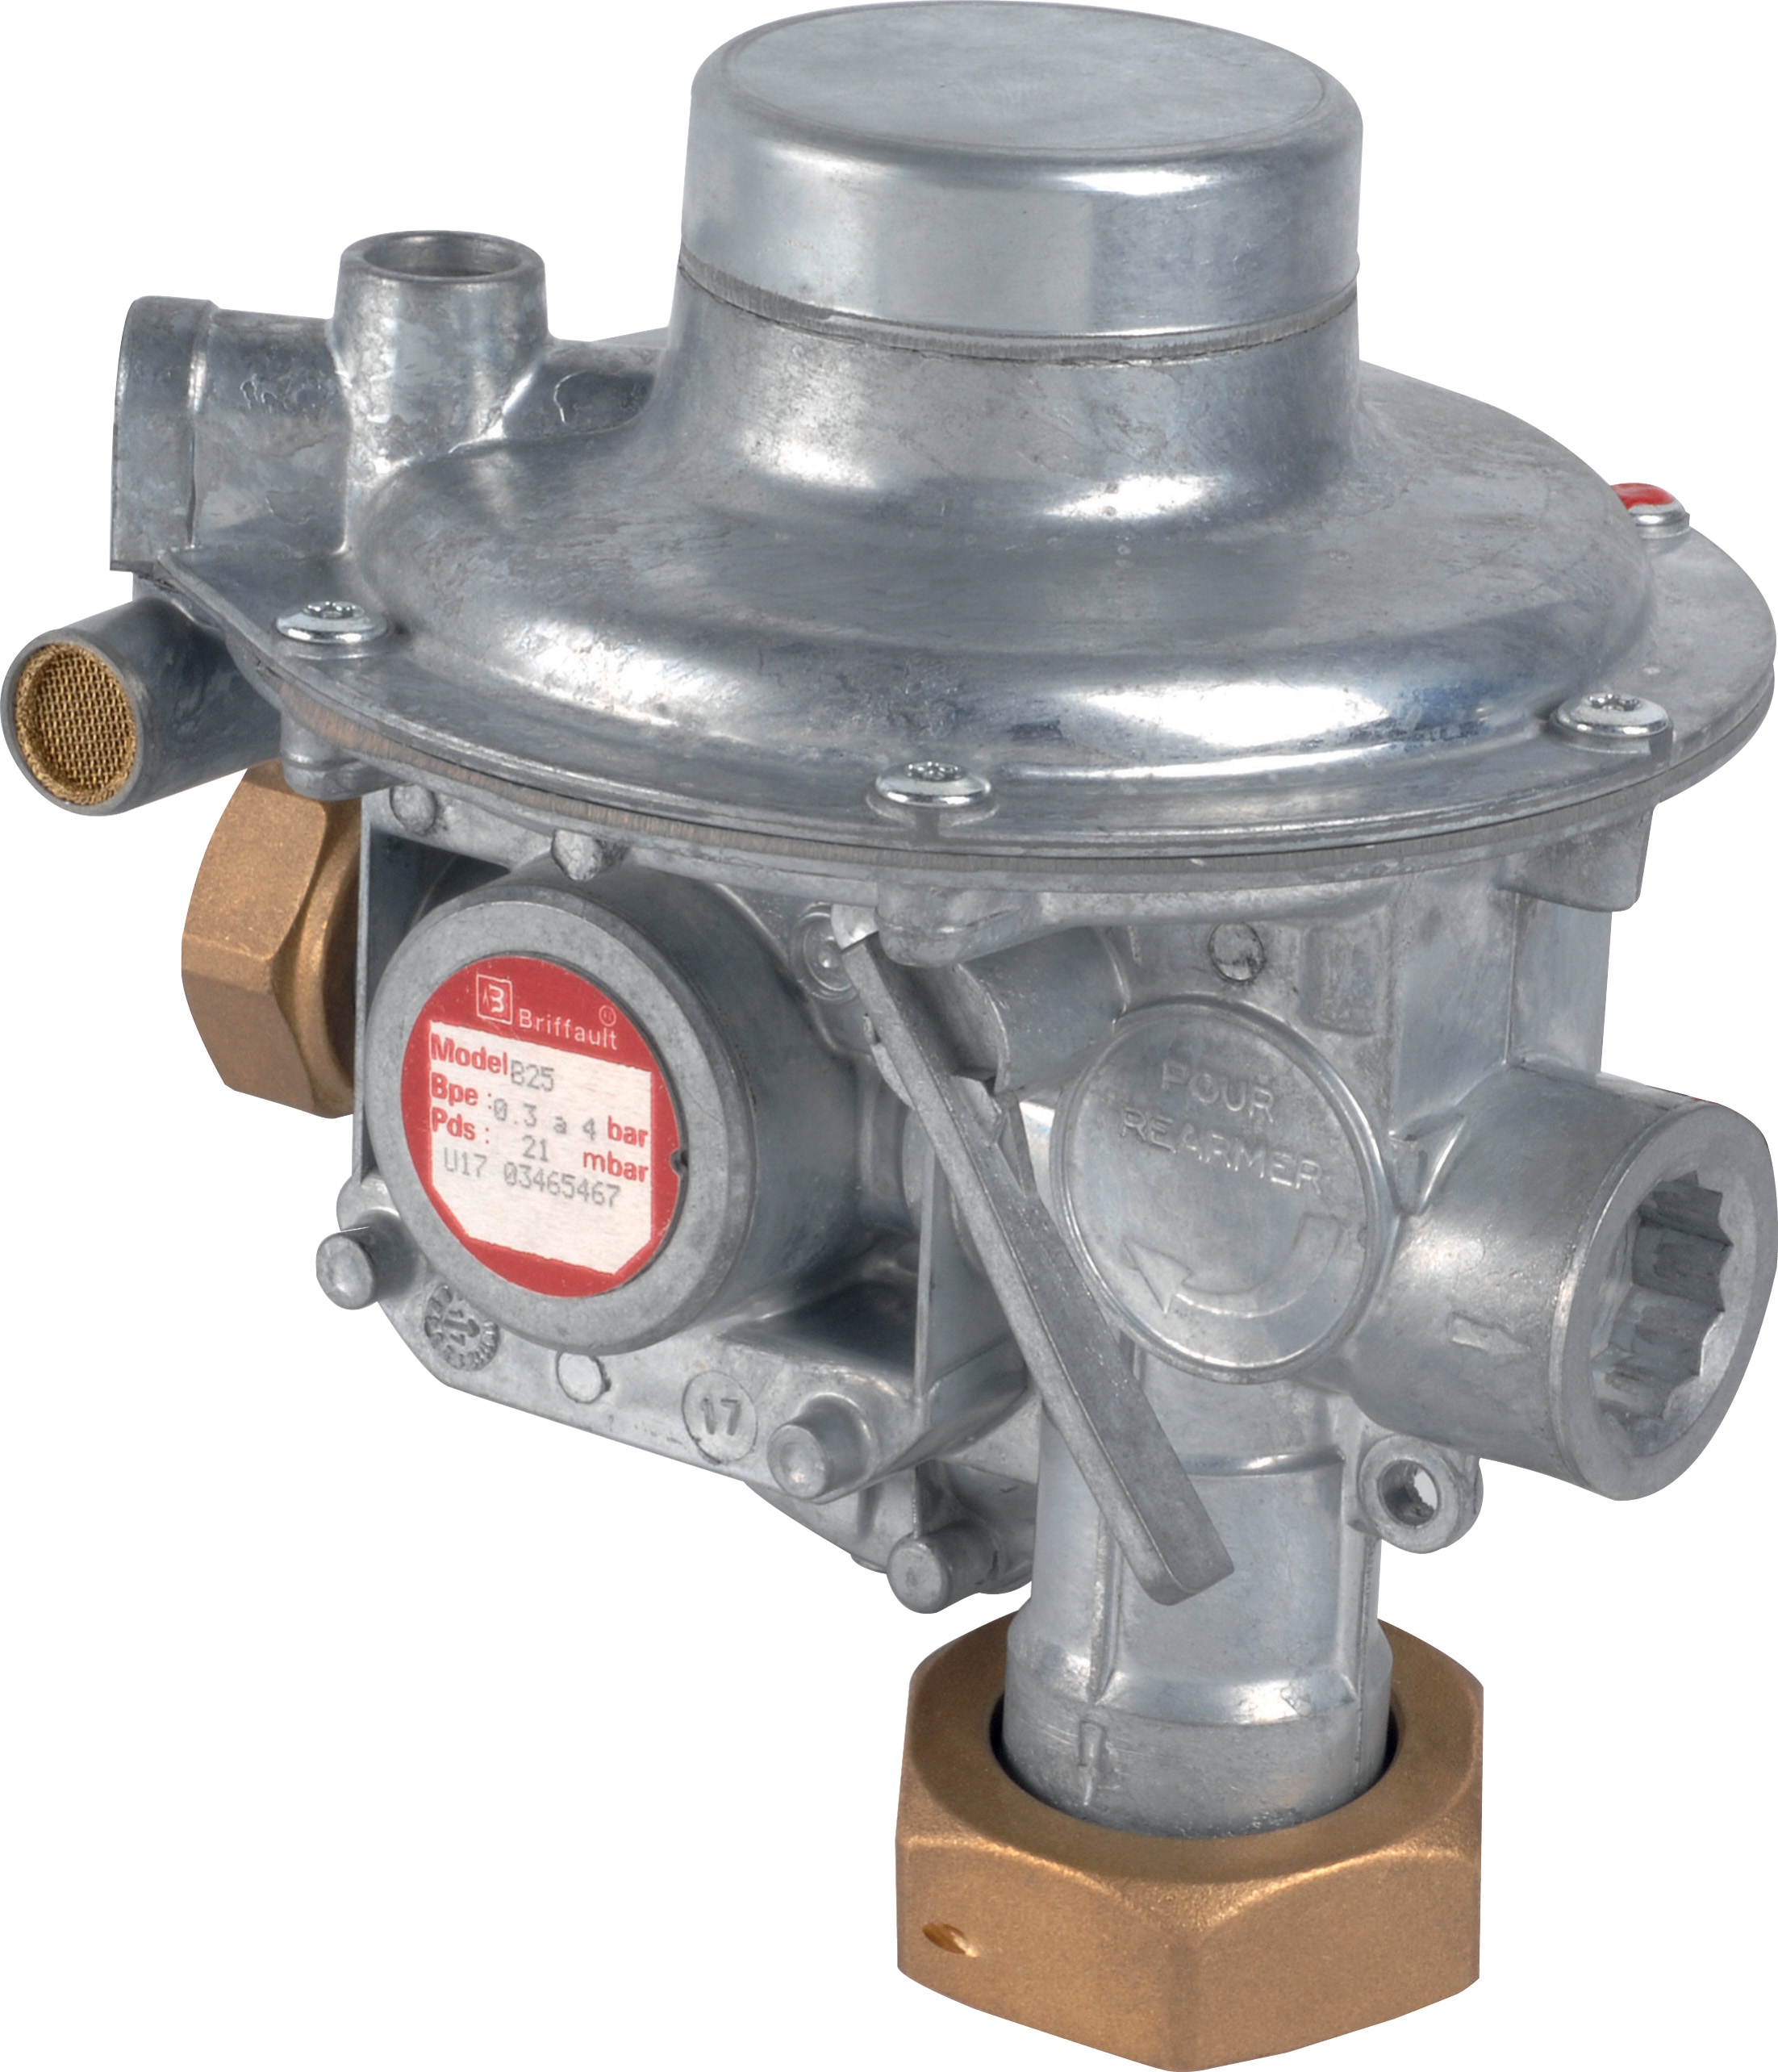
Pressure regulators and flow control devices represent critical nodes in high-pressure systems where diagnostic indicators reveal systemic issues upstream and downstream. The Francel B25/37mb pressure regulator with integrated safety relief exemplifies the type of precision component that generates valuable diagnostic data when monitored systematically.
Key diagnostic indicators for pressure regulation systems:
- Outlet pressure drift: Variations of ±2 mbar from setpoint indicate regulator diaphragm wear or seal degradation. Track trending data across 30-day intervals to distinguish between normal operating variance and degradation patterns.
- Vent discharge anomalies: Unexpected gas flow from safety relief ports signals system overpressure, typically caused by downstream blockages or seal failures in connected equipment. Measure vent discharge frequency and volume to pinpoint the fault location.
- Response lag during transients: When demand suddenly increases, regulators should stabilize outlet pressure within 200 milliseconds. Extended response times suggest internal passage restrictions or spring fatigue.
- Acoustic signatures: Audible hissing, whistling, or chattering during operation indicates internal turbulence, seal wear, or partial blockages. Document these acoustic patterns with smartphone recordings for baseline comparison.
1. Establish baseline pressure readings under three operating conditions: idle (no flow), normal load (50% capacity), and peak load (100% capacity)
2. Record ambient temperature, inlet pressure, and outlet pressure simultaneously—pressure regulation performance is temperature-dependent
3. Monitor vent discharge using a calibrated flow meter monthly; trending data reveals gradual seal degradation before catastrophic failure
4. Compare acoustic signatures monthly using standardized recording protocols; deviations from baseline often precede measurable pressure changes by 2-4 weeks
5. Review historical pressure logs quarterly to identify seasonal patterns or load-related anomalies
This diagnostic discipline directly influences procurement decisions: if analysis reveals that your regulator fleet exhibits seal degradation at 18-month intervals despite a 24-month design life, you should negotiate extended warranty coverage or consider alternative suppliers before the next refresh cycle.
Section 2: Performance Analysis and Failure Mode Recognition in High-Flow Pump Systems
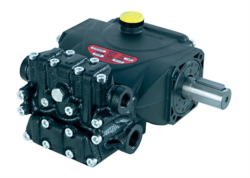
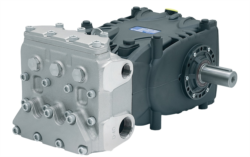
Industrial pump systems—particularly high-performance units like the Pratissoli KF30 (106 L/min, 200 bar) and Pratissoli MW40 (211 L/min, 210 bar) pump families—generate multiple diagnostic signals that procurement engineers must learn to interpret for effective Maintenance & Service planning.
Critical failure modes and their diagnostic signatures:
- Volumetric efficiency loss (flow degradation): A pump delivering 10% less flow than nameplate at constant speed and pressure indicates internal leakage, typically from worn impellers or seal deterioration. Measure actual flow rate weekly using calibrated flow meters; trending data below 95% of nameplate warrants component inspection within 2 weeks.
- Pressure stability fluctuations: Pumps experiencing cavitation or inlet starvation produce pressure ripples (±5-10 bar oscillations) visible on high-speed oscilloscopes. This condition damages downstream components and must be corrected immediately.
- Bearing temperature elevation: Monitor bearing housing temperatures continuously; increases of 15°C above baseline indicate accelerated wear or misalignment. Temperature rise typically precedes catastrophic bearing failure by 3-7 days.
- Vibration signature changes: High-frequency vibration increases (measurable in the 5-15 kHz range) correlate with impeller wear, while low-frequency vibration increases (0.5-2 kHz) indicate alignment issues or worn motor mounts.
- Inlet noise and cavitation indicators: Audible cavitation (popcorn-like crackling) at pump inlet signals inadequate suction lift, improper inlet filter sizing, or air leakage into the inlet line.
1. Establish baseline performance data for each pump installation: volumetric flow rate (measured), discharge pressure, inlet pressure, motor current draw, bearing temperature, and vibration signature (acceleration in g-force across 0-20 kHz frequency range)
2. Log data points hourly during the first 40 operating hours (break-in period), then daily for the first month, then weekly thereafter
3. Calculate running average efficiency trends; efficiency typically declines 0.5-1% monthly during normal operation
4. Trigger component inspection when any metric deviates >5% from baseline
5. For pumps operating continuously (>18 hours daily), implement thermography every 4 weeks to detect localized hot spots indicating bearing distress
6. Compare year-over-year efficiency data to distinguish between normal degradation and accelerated wear
For procurement purposes, this diagnostic data becomes contractual leverage: if a pump supplier claims a design life of 5,000 hours but your diagnostic trend analysis shows 8% efficiency loss at 3,200 hours (versus expected 4% loss), you have quantified evidence to support warranty claims or supplier negotiations.
Section 3: Nozzle Performance Monitoring and Spray Pattern Diagnostics
The Euspray flat jet nozzle (1/4" M BSPT, 25° angle) and similar spray components represent the system interface where liquid or gas meets application—making nozzle diagnostics particularly valuable for identifying upstream system issues.
Diagnostic indicators for spray systems:
- Spray pattern degradation: Uniform flat jet patterns deteriorate into asymmetrical or dispersed patterns when internal orifices experience mineral deposits, corrosion, or particle clogging. Visual inspection under standardized lighting conditions every 2 weeks provides early detection.
- Flow rate variance: Measure actual spray flow rate and compare to nameplate rating; variance >±3% indicates internal obstruction or partial blockage. Filter bypass indicators often provide indirect measurement of system contamination levels.
- Pressure drop across nozzle: A properly functioning nozzle exhibits consistent pressure differential; increasing differential indicates progressive restriction. Monitor this measurement weekly; consistent increase >1 bar per month warrants nozzle cleaning or replacement.
- Spray angle divergence: Nozzles maintain consistent spray angles; angle widening (>±2° from nominal) signals internal erosion or baffle wear. Use high-speed video analysis monthly for quantitative assessment.
- Acoustic feedback: Some nozzle types produce characteristic acoustic signatures during operation; noise level changes indicate internal erosion or cavitation conditions.
1. Document baseline spray pattern photographically under standardized pressure and flow conditions (lighting angle, distance, background)
2. Measure actual flow rate weekly using graduated containers and calibrated timing; record ambient temperature (density-dependent)
3. Monitor system pressure upstream and downstream of the nozzle daily; calculate nozzle pressure differential
4. Implement high-speed video recording (1,000 fps minimum) quarterly to analyze spray structure and particle distribution
5. Compare acoustic signatures (pitch, volume) monthly using smartphone recording apps with frequency analysis capabilities
6. Correlate spray pattern changes with upstream component diagnostics (pump pressure ripple, air contamination levels, fluid condition)
7. Establish replacement triggers: replace when flow variance exceeds ±5% OR spray angle deviation exceeds ±3° OR pressure drop increases >1.5 bar from baseline
Procurement application: Nozzle performance data directly informs supplier selection for high-wear applications. If your diagnostics reveal that certain nozzle brands experience orifice erosion 30% faster than competitors in your specific application conditions, this becomes quantified justification for premium pricing on erosion-resistant designs.
Section 4: Integrated Maintenance & Service Strategy—From Diagnostics to Procurement Decision-Making
Transforming diagnostic data into procurement decisions requires systematic frameworks that connect equipment behavior to component selection, supplier relationships, and budget allocation.
Diagnostic-driven procurement methodology:
1. Failure pattern analysis: Aggregate diagnostic data from your equipment fleet across 12-month periods. Identify components exhibiting systematic degradation patterns faster than design specifications. Flag these items for alternative supplier evaluation or premium variant consideration.
2. Root cause tracing: When a component fails prematurely, conduct structured root cause analysis using diagnostic data from the entire system. Often, regulator pressure drift results from upstream pump cavitation, or nozzle blockage results from inadequate fluid filtration. Procurement must address root causes, not just replace failed components.
3. Supplier performance scorecards: Maintain quarterly scorecards for key suppliers tracking: warranty claim approval rates, mean time between failures (MTBF), diagnostic signature consistency (equipment variability), and technical support responsiveness. Use this data to negotiate volume commitments and pricing with suppliers meeting performance thresholds.
4. Preventive replacement strategies: Diagnostic trending enables predictive replacement before failure. For example, if pressure regulator seal degradation consistently occurs at 18-month intervals with the current supplier, implementing 15-month replacement intervals (during maintenance windows) costs less than emergency component replacement and production downtime.
5. Total cost of ownership (TCO) recalculation: Update TCO models annually using your diagnostic failure data. Initial component cost often represents <20% of TCO when unplanned downtime, emergency service calls, and secondary component damage are included.
Implementation roadmap for procurement engineers:
- Months 1-3: Audit current diagnostic capabilities. Identify gaps in measurement infrastructure (flow meters, pressure transducers, thermography equipment). Budget for diagnostic instrumentation if lacking.
- Months 3-6: Establish baseline performance data for all critical equipment. Document baseline pressure, flow, temperature, vibration, and acoustic signatures. Create photographic and video baseline records for visual inspection items.
- Months 6-12: Implement continuous monitoring systems (where feasible) or structured periodic monitoring protocols (daily, weekly, monthly) for critical components. Train operations and maintenance staff on diagnostic procedures and data collection standards.
- Months 9-24: Trend diagnostic data to identify performance patterns. Begin correlating failure events with diagnostic anomalies that preceded them. Document lead-time between diagnostic anomaly detection and failure.
- Months 18+: Use accumulated diagnostic history to inform supplier negotiations, warranty terms, and component selection decisions. Shift from reactive procurement to predictive procurement based on your equipment's actual performance trajectory.
3G Electric's 35+ years in industrial equipment distribution reflects recognition that suppliers succeeding long-term are those helping customers transition from reactive to predictive maintenance mindsets. This diagnostic framework represents the procurement engineering best practice that separates organizations achieving 95%+ equipment availability from those experiencing unpredictable downtime.
Maintenance & Service Implementation in Singapore Operations
Singapore's tropical climate and intensive manufacturing environment create specific diagnostic challenges: high ambient temperatures accelerate fluid degradation and bearing wear, while humid conditions promote corrosion in exposed actuators and sensor elements. Extend baseline monitoring frequencies by 25-30% compared to temperate climates, and implement sealed enclosures for all pressure transducers and acoustic monitoring equipment.
Partnering with 3G Electric for component supply positions your organization to leverage supplier expertise in interpreting diagnostic data within regional operating conditions. Our technical support staff maintains awareness of how Singapore's operational context influences equipment behavior, enabling faster root cause identification when diagnostic anomalies appear.