Burners & Combustion: Real-Time Monitoring and Troubleshooting for Maintenance Teams
For maintenance teams across Southeast Asia, Burners & Combustion systems represent some of the most critical—and most problematic—equipment on industrial plants. Unlike components that fail suddenly, burners degrade incrementally: efficiency drops 2–3% per month as combustion conditions worsen, but operators rarely notice until flame instability or fuel wastage becomes undeniable. Over 35 years as a distributor of industrial equipment, 3G Electric has supported maintenance teams managing thousands of burner installations across the region, and we've seen the same pattern repeatedly: teams that monitor burner performance in real time avoid 70% of emergency shutdowns.
This guide focuses on what maintenance teams actually need to know—how to read burner behavior, diagnose root causes in the field, and execute repairs that stick.
Section 1: Reading Burner Behavior and Early Warning Signs
The Three Performance Indicators You Must Track
Every burner tells a story through three measurable outputs. Learning to read these tells you exactly what's happening inside the combustion chamber.
Fuel Flow Rate Drift
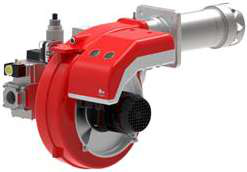
Your burner is specified to deliver a precise fuel mass per unit time—for example, the FBR HI-GAS P1500/M CE TL operates across a 60–206 kg/h range depending on load. When actual fuel flow drifts above the setpoint without a load increase, your burner is working harder to maintain the same thermal output. This is the earliest warning sign of fouling, nozzle degradation, or air-path blockage.
Measure fuel flow daily using your fuel meter or controller readout. A 5% drift over one week is normal; a 10% drift in 72 hours signals immediate investigation.
Excess Air Coefficient (Lambda) Creep
Combustion efficiency depends on maintaining the correct air-fuel ratio. When lambda (the ratio of actual air to theoretical air needed for complete combustion) rises above design setpoint—typically 1.10–1.25 for gas burners—you're burning excess oxygen, wasting fuel. A creeping lambda indicates either:
- Air inlet blockage (dust, corrosion, insect nests)
- Flame scanner fouling (oil residue, soot)
- Burner head carbon accumulation
If your control system shows lambda trending upward week-on-week, this is correctable before catastrophic failure.
Ignition Attempts and Lockout Frequency
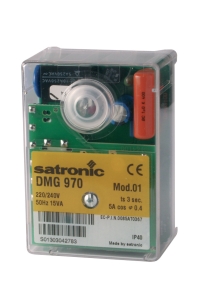
How many times does your burner attempt ignition before main flame establishes? Modern control relays like the Satronic Relay DMG 970-N MOD.01 log these attempts. One or two attempts is normal; more than three indicates weak ignition energy, contaminated igniter tips, or unstable fuel pressure at startup. Track lockouts religiously—each one is a precursor to a failed start that could halt production for hours.
Why Symptom Patterns Matter More Than Single Readings
A single high fuel flow reading means nothing. But fuel flow climbing 2% per week, coupled with rising lambda and occasional ignition stumbles, tells you fouling is active right now. Maintenance teams that correlate three indicators simultaneously make diagnoses in 15 minutes instead of guessing for days.
Section 2: Field Diagnostics—What to Test and How
The Five-Minute Combustion Quality Audit
You don't need lab equipment to diagnose 80% of burner problems. Every maintenance team should carry four items: a combustion analyzer (hand-held, ~$800–1500), a pressure gauge set, a flashlight, and a notebook.
Step 1: Measure Flue Gas Composition
Insert your combustion analyzer probe into the flue outlet (downstream of the burner, where exhaust gases have stabilized). Record three values:
- CO₂: Should match design specification (typically 9–12% for gas burners). If CO₂ is 2–3% below spec, excess air is present. If CO₂ is above spec, combustion is incomplete.
- O₂: Complements CO₂ reading. Typical setpoint is 3–5%. O₂ above 8% signals air-path blockage or nozzle wear.
- CO: Must be below 100 ppm. Any CO above 200 ppm indicates incomplete combustion—typically caused by fouled nozzles, misaligned burner head, or insufficient air mixing.
Comparison: Take readings on day 1, then weekly. A 1% drift in CO₂ over two weeks is normal. A 2% drift in four days flags immediate attention.
Step 2: Verify Fuel Pressure and Supply Flow
Inline fuel pressure gauges should show:
- Gas burners: 17–30 mbar at burner inlet (depends on modulation stage)
- Oil burners (like the FBR KN 350/M): 8–12 bar for heavy oil
If pressure oscillates more than ±2 mbar, suspect fuel pump degradation or clogged filters. Pressure that drops under load indicates undersized supply lines or failing pressure regulation.
Step 3: Visual Flame Inspection
With the burner running, observe flame color and stability through a burner peephole or camera (do not look directly):
- Golden-yellow flame: Ideal combustion with slight excess air.
- Blue flame: Oxygen-rich, possibly lean air-fuel ratio or high air velocity.
- Orange-red flame: Carbon-rich, incomplete combustion. Stop burner immediately—this indicates nozzle blockage or air shortage.
- Flickering or pulsing flame: Unstable combustion. Check fuel pressure, air inlet, and flame scanner alignment.
Flame stability is your real-time indicator. If it wavers more than ±10 mm from center, investigate that day.
Step 4: Check Ignition Energy and Flame Detection
For gas burners with ignition, request a "high-voltage spark test" from your control relay. Modern relays (including the Satronic DMG 970-N MOD.01) will log ignition voltage and flame detection signal strength. If spark voltage drops below 7 kV or if the UV flame signal is weak, igniter or scanner cleaning is needed before the next start cycle fails.
Root Cause Diagnosis Framework
Use this decision tree when troubleshooting:
- Fuel flow rises, lambda stable: Likely nozzle wear or burner head carbon. Schedule nozzle replacement.
- Lambda rises, fuel flow stable: Air inlet blockage or flame scanner fouling. Clean air filter and scanner tips.
- CO₂ drops, O₂ rises, CO acceptable: Excess air condition. Check for air leaks in combustion chamber gasket.
- CO above 200 ppm, yellow flame: Fouled nozzle. Remove and soak in solvent; replace if cleaning fails.
- Ignition attempts exceed 3, low flame signal: Dirty igniter tip or weak spark. Replace igniter and check UV scanner window.
Section 3: Repair Execution and Preventive Component Replacement
Nozzle Replacement Protocols
The nozzle is the single most replaceable wear component in any burner. The FBR HI-GAS P550/M CE TL and larger models all use cartridge-style nozzles rated for 2000–4000 operating hours.
When to replace:
- Every 12 months (preventive)
- When CO exceeds 200 ppm
- When fuel flow drifts >10% above setpoint
- After any flame-out or hard start
1. Isolate burner (close fuel valves, kill electrical supply)
2. Allow 15 minutes cooling
3. Unscrew nozzle cartridge (usually 2 bolts, 17–24 mm wrench)
4. Inspect nozzle tip for carbon buildup (black crust), corrosion, or erosion. This tells you why it failed.
5. Install new cartridge, hand-tighten then use torque wrench (typically 45–65 Nm)
6. Confirm fuel supply pressure before restarting
7. Run combustion analysis within 10 minutes of restart
Cost: A replacement nozzle costs $300–600. One preventive replacement prevents $15,000–50,000 in unplanned downtime.
Flame Scanner and Igniter Maintenance
The Satronic Relay DMG 970-N MOD.01 monitors both UV flame scanners and ignition spark. These sensors foul fastest in dusty or humid environments (common in Southeast Asia's tropical climate).
Quarterly maintenance schedule:
- Remove scanner lens cover and wipe lens with lint-free cloth and alcohol. Oil residue and soot reduce signal strength by 40%.
- Inspect igniter electrode tip for erosion or carbon deposits. Replace if pitted.
- Check all wiring connections for corrosion, especially near burner (high heat cycling).
- Flame signal strength drops below 50% of baseline (if your system logs this)
- Intermittent lockouts during normal operation
- Delayed flame detection (burner runs 2–3 seconds before control relay confirms flame)
Control Relay Testing Without Specialist Equipment
Maintenance teams often hesitate to test safety relays, fearing equipment damage. Modern relays are robust. The Satronic DMG 970-N MOD.01 has built-in self-diagnostics:
1. Power-up sequence test: When you energize the relay, it runs a self-check. Any LED codes (usually amber/red) indicate internal faults. Document any codes in your log.
2. Flame detection sensitivity: Simulate a loss of flame by blocking the scanner. The burner should lockout within 2 seconds. If it runs past 5 seconds, sensitivity has drifted and the relay needs attention.
3. Ignition command verification: Request a manual ignition cycle. Count the spark attempts. More than 4 attempts before establishing main flame suggests weak ignition drive.
These three tests take 10 minutes and catch 90% of relay problems before they cause failures.
Section 4: Monitoring Documentation and Predictive Maintenance
Building a Burner Health Log
Maintenance teams that keep records outperform those that don't. Your log should capture:
- Date and time of reading
- Fuel flow rate (kg/h)
- Inlet fuel pressure (bar or mbar)
- Flue gas composition (CO₂, O₂, CO)
- Burner runtime (hours or percentage of day)
- Flame stability (1–10 scale, or binary: stable/unstable)
- Any anomalies (hard starts, unusual noise, odor)
- Maintenance action taken and parts replaced
Spreadsheet software or simple paper logs work equally well. The value is not the medium—it's the consistency.
Predictive Indicators: What Trends Tell You
After 3–4 weeks of logging, patterns emerge:
- Linear drift: Gradual, steady change (e.g., fuel flow +1% per week) indicates slow fouling. Schedule cleaning or replacement in 4–6 weeks.
- Step change: Sudden jump in a parameter signals failure or external change (weather, seasonal fuel quality shift). Investigate immediately.
- Seasonal variation: Southeast Asia's humidity spikes in monsoon seasons; expect 3–5% efficiency loss. Increase monitoring frequency during wet months.
- Correlation patterns: When fuel flow rises AND lambda rises simultaneously, the root cause is almost always air-inlet blockage, not nozzle wear.
Teams that recognize these patterns execute repairs proactively—before customers detect output loss or utility bills spike.
Annual Inspection and Calibration
Once yearly, schedule a full inspection:
1. Remove and inspect burner head for carbon deposits. Clean if thickness exceeds 2 mm.
2. Have your combustion analyzer calibrated against a reference (gas calibration kit, ~$200). Hand-held analyzers drift 2–3% annually in tropical climates.
3. Pressure-test fuel supply lines for leaks. Weeping connections waste fuel and degrade performance over weeks.
4. Inspect all electrical connections for corrosion. High humidity near coastal areas accelerates oxidation; apply dielectric grease to connectors.
5. Request a test certificate from your relay supplier confirming ignition voltage, flame signal strength, and lockout timing.
Conclusion
Burners & Combustion systems don't fail suddenly—they degrade predictably if you know what to measure. By executing the monitoring, diagnostic, and maintenance protocols outlined above, maintenance teams can extend burner life by 30%, reduce fuel consumption by 5–8%, and eliminate 70% of emergency lockouts. 3G Electric's 35+ years supporting industrial operations across Southeast Asia has shown us that teams with disciplined monitoring spend 20% less on burner repairs and enjoy 95% uptime versus industry averages of 85–90%. Your next steps: establish a daily fuel flow check, execute a monthly combustion analysis, and log everything. Within two months, you'll have enough data to predict maintenance needs weeks in advance.