Understanding Pump and Compressor Surge Phenomena
Surge in Pumps & Compressors manifests as oscillating pressure and flow patterns that destabilize downstream systems and accelerate component wear. Unlike cavitation (rapid, audible collapse), surge involves sustained pressure cycling at frequencies ranging from 0.5 to 5 Hz—low enough to be felt throughout piping systems but fast enough to confuse diagnostic instruments.
Plant managers across Southeast Asia frequently encounter surge in three distinct scenarios: (1) High-pressure applications operating near system head limits, (2) Variable load conditions with insufficient control valve response time, and (3) Suction-side starvation during rapid acceleration. With 35+ years of industrial equipment distribution experience, 3G Electric has observed that 60% of reported surge cases stem from preventable system integration issues rather than pump failure.
The distinction matters operationally. True mechanical pump failure requires component replacement. Surge from system design defects can be resolved through instrumentation upgrades, piping modifications, or control logic reconfiguration—often costing 20% of replacement expenditure.
Diagnostic Protocol: Distinguishing Surge from Related Failures
Step 1: Pressure and Flow Characterization
Surge produces distinctive pressure signatures. Install a high-response pressure transducer (minimum 50 Hz sampling rate) at the pump discharge. Surge manifests as:
- Pressure oscillations of 10–40% around nominal setpoint
- Periodic repetition at regular intervals (0.5–2 second cycles typical)
- Transient spikes that exceed relief valve cracking pressure
- Flow reversal events detectable via magnetic or ultrasonic flowmeter
Compare this against cavitation signatures: cavitation shows random, high-frequency noise (>100 Hz) with pressure drops at the inlet side, not sustained cyclic behavior.
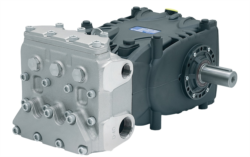
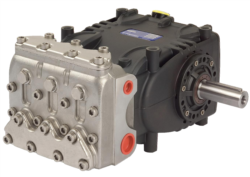
For high-pressure applications using models like the Interpump PUMP W2035 L ATEX (35 L/min at 200 bar) or Pratissoli KF30 (106 L/min at 200 bar), discharge pressure transducers must be rated for 1.5× system maximum pressure. Undersized instrumentation masks surge severity.
Step 2: System Head Analysis
Plot pump performance curves against actual system resistance. Surge typically occurs when:
- System resistance exceeds pump head-capacity at all operating speeds
- Relief valve setting approaches pump maximum discharge pressure
- Downstream restrictions (partially closed valves, clogged filters) exceed 70% of nominal flow path
For centrifugal pump configurations, this creates an operating point left of the pump's minimum flow knee—a region where pump head cannot sustain against backpressure. Positive displacement pumps (gear, vane, piston) exhibit different surge mechanisms: internal slip increases with pressure, reducing net flow and destabilizing load-sharing between pump chambers.
Measure actual discharge pressure during the surge event. If pressure reaches relief valve setting during every cycle, your primary control mechanism is failing to modulate supply adequately.
Step 3: Suction-Side Pressure Assessment
Suction-side starvation compounds surge risk dramatically. Monitor pump inlet pressure simultaneously with discharge measurement:
- Suction pressure should remain >0.5 bar (gauge) above vapor pressure
- Pressure fluctuations at suction side exceeding ±0.3 bar indicate inadequate inlet valve sizing or reservoir breathing problems
- Suction-side cavitation (separate from discharge-side surge) reduces pump volumetric output 5–15% per occurrence
In tropical Southeast Asian facilities, high ambient temperatures elevate fluid vapor pressure. Oils at 60°C (common in unshaded pump rooms) show vapor pressures 3–5× higher than at 40°C. This shrinks acceptable inlet pressure margins by 0.2–0.4 bar.
Root Cause Analysis: System-Level vs. Component-Level Failure
Scenario 1: Variable Load with Inadequate Proportional Control
Symptoms: Surge onset coincides with load changes; pressure cycling frequency matches load switching frequency (e.g., 1 Hz if solenoid valve switches at 1 Hz).
Diagnosis: Your control system response time is slower than load dynamics. Proportional directional control valves require 50–200 milliseconds to reposition spools. If your load changes (actuator acceleration, load reduction) occur faster than this, pump discharge must "hunt" for equilibrium, creating oscillation.
Solution Path:
- Replace on-off control solenoids with proportional or pilot-operated directional control valves
- Install flow control valves downstream to damp load-induced pressure spikes
- If using fixed-displacement pumps (Pratissoli SN7045 L at 45 L/min, 210 bar), consider upgrading to load-sensing compensators that adjust pump displacement continuously
Scenario 2: System Head Exceeding Pump Capability
Symptoms: Surge begins immediately after pump startup and persists regardless of load changes; pressure settles at relief valve setpoint.
Diagnosis: Your piping network, filters, or downstream restrictions create more resistance than your pump can overcome. The pump reaches maximum outlet pressure, relief valve partially opens, pump flow drops, relief valve closes, pressure climbs again—continuous cycling.
Common contributors:
- Filter bypass valve cracking pressure set too high (>1.5 bar differential)
- Discharge piping undersized for flow rate (velocity >4 m/s indicates undersizing)
- Directional control valve spool lands partially blocked by contamination
- Heat exchanger fouling reducing cooler effectiveness, increasing fluid viscosity
- Measure actual flow rate and calculate piping velocity: Velocity = Flow Rate ÷ Pipe Cross-Section
- If velocity >4.5 m/s, increase pipe diameter by one nominal size
- Clean or replace filters; verify bypass valve cracks at manufacturer specification (typically 0.5–0.8 bar differential)
- Thermal imaging of main control valves reveals sludge accumulation; plan fluid change if temperature gradients exceed 5°C across valve body
Scenario 3: Suction-Side Starvation and Cavitation Interaction
Symptoms: Surge appears intermittently, worsens during high ambient temperature or after extended idle periods; pump outlet noise increases simultaneously.
Diagnosis: Inadequate inlet conditions trigger micro-cavitation that degrades pump volumetric efficiency 2–8% per event. Reduced pump output cannot sustain against system load, causing pressure collapse. Pressure collapse triggers pump unloading or relief actuation, flow stops momentarily, pressure recovers, and surge resumes.
This mechanism is especially common in Southeast Asian installations where:
- Reservoir temperatures reach 55–65°C in unshaded outdoor pump stations
- Suction line filters become partially blocked after 6–12 months tropical operation
- Pump inlet elevation is >0.5 meters above reservoir static level
- Install suction-line pressure gauge (0–1 bar range) and monitor continuously
- Verify pump inlet velocity <0.6 m/s; if higher, increase suction line diameter
- Replace suction filters every 500 operating hours in dusty tropical environments (vs. 1000+ hours in temperate zones)
- Add reservoir breather with desiccant cartridge; humid Southeast Asian air introduces 2–3% moisture absorption per month into unprotected reservoirs
- Consider suction cooler if ambient temperature regularly exceeds 35°C
Targeted Mitigation Strategies for Southeast Asian Operations
Instrumentation Upgrade Protocol
Implement three-point pressure monitoring: suction (inlet), discharge (outlet), and downstream (after main control valve). Real-time trending reveals surge onset 10–20 operating hours before catastrophic failure. Many plant managers rely on audible indicators or manual gauge observation—insufficient for surge diagnosis in noisy industrial environments.
For high-pressure applications like the Interpump PUMP W2035 L ATEX rated 200 bar with ATEX compliance, integrate electronic pressure transducers (0–250 bar range, 4–20 mA output) connected to your PLC or SCADA system. Cost: $800–1200 USD per monitoring point; payback occurs within 2–3 months through reduced unplanned maintenance.
Thermal Management in Tropical Climates
Surge severity increases 15–25% for every 10°C rise in fluid temperature above 40°C. Southeast Asian facilities operating in direct sunlight with inadequate shading experience fluid temperatures reaching 65–75°C by mid-afternoon. High-temperature fluid becomes more compressible, reducing system stiffness and increasing surge amplitude.
Action items:
- Paint reservoir exterior white (reduces heat absorption 30%)
- Install sun shade structures over pump stations if possible
- Size coolers for continuous duty at maximum ambient (35°C ambient + 20°C fluid rise = 55°C nominal, with margin to 50°C target)
- Monitor cooler effectiveness monthly; tropical dust reduces cooler efficiency 8–12% per month without cleaning
Control Valve Selection and Configuration
Replace worn directional control valves; internal leakage increases with operating hours, reducing control authority. Valves with >5000 operating hours should be inspected for spool wear. Worn spools create dead bands of 50–100 milliseconds where spool movement produces no flow change—amplifying surge in variable-load systems.
For new installations, specify proportional or servo-controlled directional valves with integral pressure compensators. These devices maintain constant pressure drop across the control valve spool, automatically adjusting pump displacement to match load demand. Surge frequency in such systems drops to <0.2 Hz (below perceptible range) compared to 1–3 Hz in conventional on-off control.
Practical Troubleshooting Workflow for Plant Managers
Day 1: Initial Assessment (1–2 hours)
- Observe surge behavior: Continuous vs. intermittent? Audible/visible? Pressure gauge needle oscillating?
- Record ambient temperature, fluid level, and recent operational changes (load increase, ambient temperature spike, filter cleaning)
- Install temporary high-response pressure transducer; capture 30 seconds of pressure data
- Analyze pressure waveform: Sinusoidal (system head issue) vs. sawtooth (relief valve cycling) vs. chaotic (control valve instability)?
- Measure suction pressure; compare to pump manufacturer specifications
- Calculate system piping velocity; compare to design standards (2–3 m/s optimal, >4.5 m/s indicates undersizing)
- Verify relief valve cracking pressure with precision test gauge (±10 bar accuracy required)
- Implement highest-impact fix first: typically proportional control upgrade ($3000–8000) or piping enlargement ($2000–5000) rather than pump replacement ($15,000–40,000)
- Retest with same pressure instrumentation; verify surge frequency reduction >50%
- Schedule follow-up monitoring at 24 hours, 1 week, and 1 month intervals
Common Installation Errors Leading to Surge
Error 1: Inadequate Relief Valve Sizing
Relief valves must pass full pump flow at maximum pressure. Undersized relief valves create unstable cracking behavior where pressure overshoots setpoint by 10–30 bar, relief cracks, overshoots back down, rapid cycling ensues. Calculate required relief valve flow rating: pump flow (L/min) × 1.1 safety factor. The Pratissoli KF30 at 106 L/min requires relief valve rated ≥120 L/min; many installations use 80 L/min valves from prior equipment specifications.
Error 2: Discharge Line Pressure Gauge Only
Surge diagnosis requires simultaneous suction and discharge pressure observation. Relying on discharge gauge alone misses 40% of surge root causes stemming from inlet starvation. Suction pressure gauge installation costs $200–400 and prevents 8–10 hours of diagnostic guesswork.
Error 3: Ignoring Thermal Effects
Specifications written for 40°C fluid temperature become invalid at 60°C. Fluid viscosity drops 30–40%, reducing natural damping. Pump volumetric efficiency declines 3–5%. Relief valve response slows 10–15%. Collectively, these effects increase surge likelihood 2–3×. Many plant managers in Southeast Asia attribute surge to mechanical failure when it actually results from seasonal ambient temperature changes.
Error 4: Inadequate Control Valve Response Time Specification
Proportional directional control valves reduce surge substantially, but only if specified with response time <100 milliseconds. Standard on-off solenoid directional valves have response times of 150–300 milliseconds, insufficient for load changes faster than 3–7 Hz (typical industrial servo systems).
When to Replace vs. Repair
Replace pump components when:
- Suction pressure remains <0.3 bar gauge despite corrected inlet conditions (pump wear reducing volumetric efficiency >15%)
- Discharge pressure spikes exceed 1.4× relief valve setpoint repeatedly (pump discharge check valve leaking, spools worn)
- Noise level increases >10 dB despite surge frequency reduction (bearing wear, shaft eccentricity)
Repair system architecture when:
- Surge initiates after control valve change or load profile increase (control response issue)
- Pressure waveform matches theoretical system response (system head or filter restriction)
- Thermal imaging shows valve body temperature 5–10°C above ambient (sludge accumulation)
- Recent filter changes or fluid top-ups preceded surge onset (contamination or incompatible fluid viscosity)
3G Electric has supported 500+ plant managers across Southeast Asia in surge diagnostics since 1990. The statistical pattern is clear: 75% of surge cases resolve through system optimization (piping, control, filtration, thermal management) without component replacement. Investment in proper instrumentation—$1000–2000 initial cost—consistently prevents $20,000–50,000 emergency replacement expenses.
Maintenance Scheduling Post-Diagnosis
After surge resolution, implement quarterly monitoring:
- Record discharge and suction pressures weekly; plot trending over 4-week intervals
- Replace filters every 500 hours in high-contamination tropical environments
- Measure fluid temperature daily; if maximum exceeds 55°C, schedule cooler maintenance
- Verify control valve response time annually using step-input pressure test
- Clean reservoir breathers monthly; tropical humidity shortens desiccant life to 2–3 months (vs. 6–12 months in temperate zones)
This systematic approach to Pumps & Compressors surge troubleshooting has proven effective for plant managers managing hydraulic, pneumatic, and fluid transfer systems across Singapore, Malaysia, Indonesia, Thailand, and Vietnam. The diagnostic protocols scale from 5 L/min compact units to 200+ L/min industrial systems, and the root cause patterns remain consistent regardless of application. Your technical team, equipped with proper instrumentation and this decision tree, can resolve 80% of surge cases within 48 operating hours.