Understanding Pumps & Compressors Condition Monitoring in Singapore's Industrial Environment
Pumps and compressors form the hydraulic and pneumatic backbone of Singapore's manufacturing, marine, and energy sectors. Unlike preventive maintenance that follows fixed schedules, condition monitoring enables maintenance teams to detect degradation before failure occurs. With 3G Electric's 35+ years of experience distributing industrial equipment across Southeast Asia, we've observed that condition-based maintenance reduces unexpected downtime by 40-60% and extends pump and compressor lifespan by 25-30%.
Condition monitoring transforms maintenance from reactive firefighting to predictive asset management. Singapore's humid tropical climate, coupled with 24/7 industrial operations, creates unique stress on pumps and compressors—higher corrosion rates, thermal cycling, and continuous duty cycles demand vigilant monitoring. This guide equips maintenance teams with diagnostic frameworks to identify early warning signs before they cascade into full system failures.
Section 1: Core Condition Monitoring Parameters for Pumps & Compressors
Vibration Analysis: The Primary Diagnostic Tool
Vibration monitoring is the gold standard for detecting mechanical wear in pumps and compressors. Different failure modes produce distinct vibration signatures:
Normal Operating Baseline:
- Velocity: 0.1–0.3 in/s RMS for rotating equipment under 3600 rpm
- Acceleration: 2–5 g peak for gear pumps and piston pumps
- Frequency content: Dominant peaks at running speed and harmonics
- Cavitation (high-frequency noise, 5–15 kHz): Indicates inlet pressure drops or air ingestion
- Bearing wear: Increasing energy in 1–5 kHz band; subsynchronous peaks around 0.35× running speed
- Gear mesh wear: Elevated energy at gear mesh frequency (number of teeth × shaft rpm)
- Velocity exceeds 0.7 in/s RMS consistently
- Broadband noise floor rises 6+ dB above baseline
- Impulsive events (kurtosis > 4) indicate spalling or bearing degradation
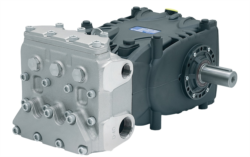
For Pratissoli KF30 pumps operating at 1450 rpm nominal, the gear mesh frequency is approximately 1450 rpm × number of teeth. Maintenance teams should establish baseline readings during the first 50 operational hours, then monitor monthly. Any increase exceeding 20% week-over-week warrants closer investigation.
Pressure and Flow Trending
Pressure ripple and flow stability reveal internal wear patterns:
- Pressure ripple growth: New positive displacement pumps exhibit 2–3 bar ripple at rated flow. If ripple increases to 5–8 bar, internal leakage is rising (typically from valve wear or piston ring degradation)
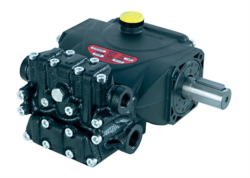
- Actual vs. theoretical flow: Pratissoli MW40 pumps deliver 211 L/min at 210 bar when new. If actual flow drops to 85% of rated (180 L/min), volumetric efficiency loss suggests seal or port-plate damage
- Flow stability: Oscillating flow (±5% fluctuation) indicates cavitation or aeration; stable, declining flow suggests progressive internal wear
Implement digital pressure transducers and flow meters at pump inlet and outlet. Log data every 4 hours during continuous operation; weekly analysis identifies trends invisible to point-in-time measurements.
Temperature Monitoring and Thermal Signatures
Temperature rise directly correlates with internal friction and efficiency loss:
- Baseline: Discharge temperature typically 10–15°C above inlet at rated flow
- Caution zone: Temperature rise exceeding 20°C or discharge temperature >55°C indicates energy loss (wear or misalignment)
- Alarm threshold: Discharge temperature >65°C; imminent seal or bearing failure likely
- Thermal imaging: Infrared thermography identifies hot spots on pump casing, indicating localized wear or blocked cooling passages
Singapore's ambient temperatures (28–34°C) and high humidity require active thermal management. Mount temperature sensors at discharge outlet and case drain return. Configure alarms at ±5°C above baseline to detect degradation early.
Section 2: Interpreting Fluid Condition as a Diagnostic Window
Oil Analysis Protocol for Pump Health Assessment
Fluid condition directly reflects internal wear. Establish quarterly oil analysis sampling—more frequent (monthly) if pump is critical or operating near pressure limits:
Key analytical parameters:
- Particle count (ISO 4406 code): Baseline for new pumps is typically 17/15/12 or better. Target maintenance window: 18/16/13. Action threshold: 20/18/15 (consider fluid change; investigate wear source)
- Ferrous content (Fe, ppm): New pumps <100 ppm. Acceptable: <200 ppm. Rapid increase (>50 ppm/month) indicates accelerated wear; investigate for bearing or gear degradation
- Acid number (TAN): Baseline <0.5 mg KOH/g. If TAN approaches 2.0 mg KOH/g, fluid oxidation is advanced; acid attacks seals and promotes corrosion
- Water content: Maximum 200 ppm for hydraulic systems. Singapore's humidity drives moisture ingress; >500 ppm degrades seal elastomers and promotes corrosion
- Viscosity index stability: Deviation >±10% from nominal indicates viscosity loss (seal wear allowing shear) or thermal degradation
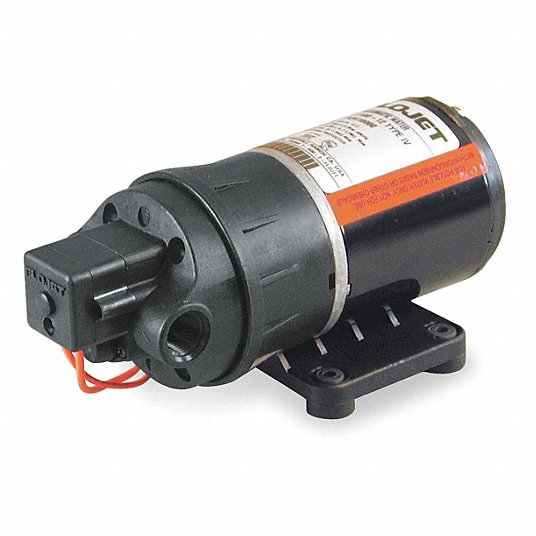
For compact pumps like Interpump E1D1808 L (2.72 kW, 8 L/min), fluid volumes are small (2–5 liters); contamination concentrates rapidly. Monthly sampling during commissioning (first 200 hours) catches manufacturing debris; transition to quarterly once particle counts stabilize.
Correlation Between Fluid Condition and Failure Risk
Maintenance teams must understand that fluid degradation and mechanical wear are bidirectional:
- Worn components generate ferrous particles → particles accelerate bearing wear → exponential failure curve
- Oxidized fluid attacks seals → leakage increases → cavitation and aeration → accelerated degradation
When particle count rises or ferrous content spikes, fluid change alone is insufficient; conduct vibration and thermal analysis to identify the wear source. The Interpump ET1C1612 SX*D20 (12 L/min, 3.68 kW) operating in contaminated fluid will experience seal degradation within 500–1000 hours; early detection via oil analysis triggers intervention before catastrophic failure.
Section 3: Implementing a Practical Monitoring Schedule for Singapore Operations
Tiered Monitoring Framework
Tier 1: Continuous Online Monitoring (Critical Pumps & Compressors)
Applied to primary production equipment, emergency response systems, or pumps protecting personnel safety:
- Permanent vibration sensors (accelerometers) with real-time data streaming
- Continuous pressure, flow, and temperature logging
- Automated alarms triggered by threshold breaches
- Review interval: Daily; alert response within 4 hours
Applied to 70–80% duty cycle pumps and compressors:
- Portable vibration analyzer (route-based monitoring): Weekly or bi-weekly
- Handheld pressure/temperature gauges: Weekly during operation
- Oil sampling: Monthly for first 6 months, then quarterly
- Review interval: Monthly trend analysis; alert response within 24 hours
- Equipment example: Pratissoli SS71153 pump (122 L/min, 37.5 kW) operating at 800 rpm in continuous duty
Applied to backup pumps, seasonal equipment, or intermittent-duty compressors:
- Portable vibration snapshot: Quarterly or pre-operation
- Pressure/temperature spot checks: Before start-up
- Oil sampling: Annually or before seasonal operation
- Review interval: Quarterly; alert response within 48 hours
Data Management and Trending
Condition monitoring generates large datasets; systematic management separates signal from noise:
1. Establish equipment baseline (first 100 operational hours):
- Record vibration signature under normal load
- Document pressure ripple and flow characteristics
- Baseline fluid analysis (particle count, viscosity, moisture)
- Baseline temperature at 25%, 50%, 75%, and 100% flow
2. Store data in structured format:
- Date, time, cumulative operating hours, ambient conditions
- Equipment state (idle, partial load, rated load, beyond rated)
- All sensor readings and calculated parameters
- Use cloud-based CMMS (Computerized Maintenance Management System) to enable remote analysis
3. Calculate trend indicators:
- Week-over-week percent change in vibration velocity
- Monthly pressure ripple progression
- 3-month moving average for temperature rise
- Ferrous particle accumulation rate (ppm/month)
4. Set intelligent alarm thresholds:
- Absolute threshold: 70% of failure point (e.g., 0.7 in/s for vibration velocity)
- Rate-of-change threshold: >5% monthly increase triggers warning
- Combination threshold: Elevated vibration + elevated temperature + rising pressure ripple = immediate investigation
Section 4: Actionable Response Protocols When Anomalies Emerge
Decision Tree: Investigate vs. Schedule vs. Replace
When condition monitoring flags an anomaly, structured decision-making prevents both unnecessary downtime and catastrophic failures:
Single parameter slightly elevated (e.g., vibration +15%, temperature +8°C):
- Action: Investigate root cause; confirm measurement accuracy
- Response timeline: Within 1 week; continue daily monitoring
- Investigation steps:
- Check operating conditions (flow, pressure, load) match baseline test conditions
- Review recent maintenance (alignment, bearing replacement, fluid change)
- If pressure ripple coincides with vibration rise, cavitation is likely; check inlet pressure and aeration
Multiple parameters trending upward simultaneously (vibration +20%, temperature +12°C, pressure ripple +4 bar):
- Action: Schedule maintenance within 2–4 weeks; increase monitoring to daily
- Response steps:
- Consider load reduction if operationally feasible
- Plan seal or internal component inspection during next maintenance window
- For KF30 pumps, a typical inspection reveals swashplate wear or valve spool stiction; correctable without full rebuild
Critical threshold breached (vibration >0.7 in/s, temperature >65°C, or particle count >20/18/15):
- Action: Remove from service; perform detailed diagnostic
- Response timeline: Immediate (within 4–8 hours)
- Diagnostic protocol:
- Particle morphology analysis (ferrous particles indicate gear/bearing wear; non-ferrous suggest seal contact)
- Pressure test of relief valve and check valves
- Bearing play measurement (if >0.5 mm on gear pump shaft, bearing replacement required)
- For high-power equipment like MW40 pumps, consider factory refurbishment vs. new unit based on failure mode and service life
Communicating Findings to Operations and Management
Condition monitoring data must translate into business language. Prepare concise reports:
- Executive summary: Equipment status (green/yellow/red), recommended action, business impact (production risk, safety risk, repair cost)
- Technical detail: Trend graphs (6-month minimum), specific parameters triggering alert, root cause hypothesis
- Action plan: Timeline for investigation or maintenance, resource requirements, production window impact
- Cost justification: Preventive intervention cost vs. estimated failure cost (unplanned downtime, catastrophic damage, safety exposure)
Example: "Pratissoli SS71153 pump vibration increased 28% over 3 weeks. Oil analysis shows ferrous content at 340 ppm (baseline 80 ppm). Suspected bearing wear. Recommended: Schedule 40-hour maintenance window within 2 weeks for full inspection. Estimated repair cost: $3,500–$5,000. Failure risk: Bearing collapse → sudden loss of 37.5 kW capacity → 12–16 hour production stoppage costing $45,000+."
Conclusion: From Monitoring to Mastery
Condition monitoring transforms maintenance teams from reactive responders to predictive stewards of equipment health. Singapore's demanding industrial environment—continuous operations, tropical humidity, high ambient temperatures—makes systematic condition monitoring essential for reliability and cost control.
With 35+ years of experience in Singapore and Southeast Asian industrial markets, 3G Electric supports maintenance teams by supplying premium pumps and compressors (Pratissoli and Interpump brands) engineered for demanding conditions, backed by technical guidance and spare parts availability. But equipment longevity ultimately depends on how well maintenance teams execute condition monitoring protocols.
Start with vibration baseline and pressure trending on critical equipment. Layer in quarterly oil analysis. Build a structured database. Set intelligent alarms. Respond systematically. Over 12–18 months, your team will achieve 40%+ reduction in unexpected failures, 25%+ extension of component life, and measurable improvement in production reliability—the true measure of maintenance excellence.