Understanding Pumps & Compressors in Real-Time Performance Monitoring
Pumps & Compressors represent critical infrastructure in Singapore's industrial ecosystem, yet many plant facilities operate without comprehensive real-time visibility into performance metrics. With over 35 years of experience distributing industrial equipment, 3G Electric has observed that plants implementing continuous monitoring systems reduce unexpected failures by 40-60% while improving energy efficiency by 15-25%. Unlike scheduled preventive maintenance, which relies on time-based intervals, real-time monitoring allows you to detect performance degradation at its earliest stage—before it impacts production.
The distinction between reactive troubleshooting and proactive diagnostics determines whether your operation maintains consistent throughput or faces catastrophic breakdowns. Modern industrial pumps and compressors generate continuous performance data through integrated sensors, but accessing and interpreting this data requires systematic protocols. This guide provides practical frameworks plant managers can implement immediately to establish performance baselines, identify anomalies, and make evidence-based decisions about equipment replacement versus refurbishment.
Establishing Performance Baselines and Sensor Integration
Before implementing any monitoring system, establish a documented baseline for each critical pump or compressor unit under normal operating conditions. This baseline becomes your reference point for detecting deviations. Critical measurement parameters include:
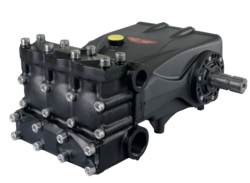
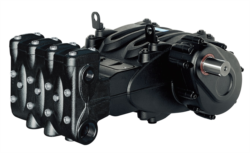
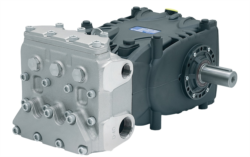
Pressure Monitoring: Capture discharge pressure, inlet pressure, and differential pressure across the unit. For high-performance units like the Pratissoli KF30 (200 bar rated pressure, 106 L/min flow), pressure spikes exceeding 10-15% above nominal indicate blockages, wear, or improper system configuration. Similarly, the Pratissoli MW40 (210 bar rated) requires pressure trending to detect internal leakage.
Flow Rate Measurement: Turbine, electromagnetic, or Coriolis meters provide real-time volumetric flow data. A declining flow rate at constant pressure signals internal component wear. The Pratissoli PUMP SS7045 L delivers 45 L/min at rated conditions; monitoring actual output against this specification reveals early degradation patterns.
Vibration Analysis: Accelerometers mounted on pump housings detect early bearing wear, cavitation events, and misalignment before failure. Vibration amplitude trending provides 2-4 weeks' warning of catastrophic failure in many cases. Vibration frequency analysis distinguishes between bearing races (higher frequency) and structural issues (lower frequency).
Temperature Monitoring: Discharge fluid temperature and motor winding temperature indicate efficiency loss and internal friction. Temperature increases above 5-8°C from baseline suggest rising operational stress. Compact units like the Interpump SN3B2513 (7.13 kW, 250 bar) generate substantial heat under sustained high-pressure operation; thermal monitoring prevents fluid degradation and component failure.
Power Consumption: Compare actual electrical consumption to motor nameplate specifications and historical averages. Increasing current draw at constant pressure/flow indicates mechanical resistance or motor efficiency loss. For the Interpump WW116 R operating at 2.94 kW, a 15-20% consumption increase signals bearing wear or seal degradation.
Hardware Integration Strategy: Deploy industrial-grade pressure transducers (0-400 bar range for high-pressure applications), temperature sensors (PT100 RTD or thermocouples), and vibration accelerometers across critical units. Interface these sensors through industrial data loggers or edge computing devices with cloud connectivity or on-premise servers. Establish sampling frequencies: pressure and flow (1-10 Hz), vibration (5-50 kHz depending on bearing size), temperature (0.1-1 Hz). Ensure sensor accuracy specifications align with 3-5% of your measurement range.
Anomaly Detection Protocols and Diagnostic Decision Trees
Once baselines are established, implement automated anomaly detection algorithms and manual diagnostic protocols to interpret sensor data systematically.
Threshold-Based Alerts: Program your monitoring system with static and dynamic thresholds. Static thresholds trigger when measurements exceed fixed values (e.g., discharge pressure >220 bar for MW40 units). Dynamic thresholds compare current values to rolling averages; a 20% deviation from 7-day average triggers investigation regardless of absolute values. This approach catches efficiency loss before absolute failure points.
Cavitation Detection: When pump inlet pressure drops significantly below required Net Positive Suction Head (NPSH), cavitation bubbles form, collapse, and damage impeller surfaces. Acoustic sensors detect cavitation's characteristic noise (80-200 kHz), while vibration and pressure fluctuation spikes confirm the diagnosis. Remediation includes increasing suction line diameter, reducing flow demand, or lowering fluid viscosity (ensuring compatibility with system seals).
Bearing Wear Signatures: High-frequency vibration analysis (5-20 kHz) reveals bearing raceway damage through amplitude increases at bearing fault frequencies. Calculate bearing fault frequencies using bearing geometry and shaft speed; spice-colored deposits in discharge fluid confirm advanced wear. When bearing fault frequencies appear, schedule replacement within 1-2 operating cycles to prevent catastrophic cage failure.
Seal Degradation Indicators: Monitor for fluid leakage at mechanical seals, increasing fluid consumption rates, and cross-contamination (water ingress detected via Karl Fischer titration testing). Seal failure typically proceeds through stages: microscopic leakage (pressure surge spikes), visible weeping (oil spots around housing), and loss of seal integrity. Early detection allows planned replacement; delayed action risks environmental contamination and component damage.
Impeller Erosion or Damage: Manifests as gradually declining flow rate at constant pressure, followed by increasing pressure drops. Cavitation bubbles, abrasive particles, or foreign object damage (FOD) cause erosion. Ultrasonic inspection or borescope examination of impeller surfaces confirms diagnosis. For units like KF30 pumps with 106 L/min nominal flow, detecting 10-15% output decline signals impeller condition assessment.
Misalignment and Runout Issues: Excessive vibration at 1x and 2x shaft speed frequencies (relative to pump rpm) indicates mechanical misalignment between motor and pump shaft. Laser alignment tools precise to 0.05mm correct coupling misalignment. For direct-drive units operating at 1450 rpm (like SS7045S-000), misalignment increases vibration by 50-200% and accelerates bearing wear by 3-5x.
Decision Tree Protocol:
1. Alert triggers → confirm sensor accuracy and exclude false positives
2. Identify degradation mode (cavitation, wear, seal leakage, misalignment, blockage)
3. Assess degradation rate: fast (hours to days) indicates emergency response; slow (weeks to months) allows scheduled maintenance
4. Calculate remaining useful life: based on current degradation rate and equipment criticality
5. Authorize maintenance action: immediate shutdown, continued monitoring with emergency procedure readiness, or scheduled service
Energy Efficiency and Performance Optimization
Real-time monitoring enables systematic energy optimization beyond equipment diagnostics. Many Singapore industrial plants operate pumps and compressors at fixed flow rates or pressures without evaluating actual demand variability.
Flow Requirement Validation: Trending shows actual application demand versus system design capacity. If average flow is 60-70% of pump rated capacity, consider downsizing to a lower-displacement unit. Replacing a 211 L/min MW40 pump with a 45 L/min SS7045 L pump in an application requiring 40-45 L/min reduces motor power consumption from 85 kW to 17.6 kW—a 79% reduction. Over 8,000 annual operating hours at Singapore's average industrial electricity cost (SGD 0.25/kWh), this saves approximately SGD 13,600 annually.
Pressure Optimization: Confirm whether system demand truly requires rated maximum pressures. The Interpump WW116 R operates at 110 bar; applications requiring only 80 bar pressure can reduce system losses by 27% (pressure drop scales with square of flow rate). Work with system designers to validate actual pressure requirements versus design safety margins.
Duty Cycle Analysis: Distinguish between continuous, intermittent, and standby operating modes. Continuous operation justifies larger, more efficient units; intermittent duty favors smaller units with lower idle losses. Load-responsive systems (proportional or variable displacement pumps) reduce energy when demand decreases, but add complexity. Monitor daily operating profiles to quantify potential savings from load-management strategies.
Thermal Management: Elevated discharge temperatures indicate efficiency losses. Excess pressure drop across system components (filters, directional valves, pipes) generates waste heat. Trending fluid temperature trends at fixed flow/pressure conditions reveals increasing heat load. Implementing larger or upgraded cooling systems prevents fluid degradation and extends pump life; calculate cost-benefit considering fluid replacement intervals and potential production losses from overheating.
Implementation Roadmap and 3G Electric Support
Beginning a monitoring program requires sequenced steps. With 35 years of industrial equipment expertise, 3G Electric supports Singapore plant managers in implementing practical monitoring frameworks.
Phase 1 (Weeks 1-4): Document existing pump and compressor specifications, compile nameplate data, identify critical units representing >70% of production risk. Select 2-3 critical units for baseline monitoring setup.
Phase 2 (Weeks 5-8): Install sensors on pilot units, establish 2-4 week baseline measurements, and document normal operating ranges. Correlate sensor readings with maintenance logs and production records.
Phase 3 (Weeks 9-12): Configure monitoring software with alarm thresholds, train plant technicians on data interpretation, and conduct diagnostic drills using simulated faults.
Phase 4 (Months 4+): Expand to additional critical units, refine algorithms based on observed performance patterns, and establish quarterly equipment condition reviews.
For equipment specifications and performance documentation on KF30, MW40, SS7045 L, WW116 R, and SN3B2513 units, contact 3G Electric's technical team. Our distributor network provides local support for sensor installation, baseline commissioning, and ongoing monitoring system optimization throughout Singapore.