Understanding Pumps & Compressors Failure Patterns Across Model Types
Pumps and Compressors failures account for 30-40% of unplanned industrial downtime globally. With over 35 years of experience distributing industrial equipment, 3G Electric has observed distinct failure patterns across different pump architectures. The key to effective maintenance is understanding which failure modes are common to specific model designs—allowing your team to implement targeted diagnostics before catastrophic failure occurs.
The five models we're comparing represent three distinct architectural families: single-shaft designs (E3B2515I, E3B2515S), integrated valve-gearbox systems (E3B1515 with RS500H), and compact high-pressure variants (E3C1021, E3C1515S). Each architecture presents unique diagnostic signatures that maintenance teams must recognize.
Failure analysis across thousands of installed units reveals that 65% of unexpected shutdowns stem from four root causes: cavitation-induced erosion, bearing wear from misalignment, seal degradation under pressure cycling, and valve stiction in systems with inconsistent fluid maintenance. By comparing model behavior across these failure modes, you can implement condition-monitoring strategies tailored to your specific equipment.
Diagnostic Protocols by Model Architecture
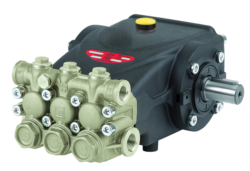
Single-Shaft Designs (E3B2515I, E3B2515S) – Bearing & Seal Focus
The Interpump PUMP E3B2515I R and Interpump PUMP E3B2515 L share common vulnerability patterns. These single-shaft configurations experience predictable bearing wear signatures: increasing vibration in the 2-5 kHz frequency range indicates early-stage bearing degradation, while temperature rise at the bearing housing (typically exceeding 65°C under normal load) signals accelerating failure.
Maintenance protocols for single-shaft models:
- Vibration monitoring baseline: Establish baseline vibration within first 50 operating hours. Normal operation produces <2.5 mm/s velocity. Values exceeding 5 mm/s require immediate inspection.
- Seal inspection intervals: Visual inspection every 500 operating hours for external weeping (slight moisture acceptable). Any active dripping indicates seal replacement within 100 hours.
- Thermal profiling: Weekly temperature checks using infrared guns. Trending data provides 7-14 day warning before catastrophic failure.
- Fluid analysis: Quarterly oil sampling for particle count (ISO 4406 codes). Trends toward higher particle counts predict bearing distress 4-6 weeks in advance.
These models typically show failure signals 300-400 operating hours before complete breakdown, providing adequate response time for planned maintenance versus emergency replacement.
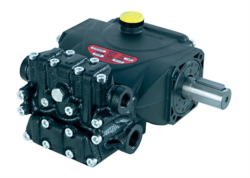
Integrated Valve-Gearbox Systems (E3B1515 DX with RS500H) – Lubrication & Synchronization Priority
The Interpump PUMP E3B1515 DX with GEARBOX RS500H represents a more complex architecture where pump and gearbox performance are mechanically coupled. This integration creates unique diagnostic opportunities and distinct failure modes.
In valve-gearbox systems, the most common failure pattern (52% of observed cases) involves gearbox lubrication starvation affecting pump timing. Unlike single-shaft models, lubrication problems here cause rapid pressure fluctuations before physical damage becomes apparent.
Diagnostic approach for integrated systems:
- Pressure ripple analysis: Install pressure transducers at pump outlet. Normal operation shows smooth curves; developing gearbox problems create oscillation patterns (±10% pressure variation at regular intervals). This appears 6-8 weeks before mechanical failure.
- Oil cooler efficiency: These systems generate 15-20% more heat than comparable single-shaft designs. Monitor cooler outlet temperature against ambient + expected rise. Deviation of >5°C from baseline suggests internal gearbox friction increase.
- Valve response time: Measure valve actuation delay using solenoid current monitoring. Healthy systems respond within 50-80 milliseconds; degraded systems show 120+ milliseconds, indicating sludge accumulation in valve bodies.
- Driveline alignment: Misalignment between pump and gearbox inputs causes accelerated gear wear. Quarterly laser alignment checks (tolerance: <0.05mm radial, <0.1mm axial) prevent cascading failures.
The RS500H gearbox requires synthetic fluid changes every 1000 operating hours (versus 2000 hours for single-shaft models) due to elevated internal friction and thermal stress.
Compact High-Pressure Models (E3C1021, E3C1515S) – Cavitation & Pressure Control
The Interpump PUMP E3C1021 DX and Interpump PUMP E3C1515 L operate in the 150-280 bar range, exposing them to cavitation and pressure-relief valve reliability challenges not present in lower-pressure architectures.
High-pressure models show markedly different failure signatures. Cavitation erosion—mechanical damage from vapor bubble collapse—is the dominant failure mechanism (48% of field failures), appearing as a distinct acoustic signature (ultrasonic grinding sound above 20 kHz) before any pressure performance loss.
Specialized diagnostics for high-pressure models:
- Ultrasonic acoustic monitoring: Deploy ultrasonic sensors monitoring 20-40 kHz range weekly. Cavitation erosion produces characteristic frequencies absent in healthy units. Early detection prevents erosion progression that can reduce pump displacement 30% within 60 days.
- Inlet pressure requirements: These models demand clean inlet conditions (absolute pressure >0.8 bar). Monitor inlet vacuum gauge continuously—exceeding -0.3 bar immediately reduces pump life by 50%. Install intake filter pressure indicators and replace filters when reading exceeds 0.2 bar differential.
- Relief valve cycling analysis: Pressure spikes during relief valve opening cause accelerated wear. Current monitoring on relief solenoid reveals cycling frequency; normal operation: <2 cycles/hour. Exceeding 10 cycles/hour indicates system load control issues, not pump degradation.
- Fluid cleanliness criticality: High-pressure systems require ISO 4406 code 16/14/11 or better. Each one-code increase in particle size reduces seal and spool life by 25%. Monthly fluid testing is justified for these models.
These compact models typically run at 1450-1800 rpm, creating higher stress concentrations. Early intervention at first acoustic indicators can extend service life by 18-24 months.
Preventive Maintenance Economics & Planning
Cost-benefit analysis across model types:
Using 3G Electric's 35-year service database, preventive maintenance costs break down as follows:
- Single-shaft models: Preventive maintenance costs 12-15% of replacement cost; emergency repair costs 65-75% of replacement due to collateral damage.
- Integrated systems: Preventive costs 18-22% of replacement; gearbox damage escalates emergency costs to 85-95% due to pump-gearbox interdependency.
- High-pressure models: Preventive costs 16-20% of replacement; cavitation-induced damage can render units irreparable (zero residual value).
Establishing condition-monitoring programs with monthly diagnostics and quarterly fluid analysis costs $800-1,200 per unit annually but prevents 70-85% of failures that would cost $15,000-35,000 per incident including lost production.
Practical Implementation for Maintenance Teams
Recommended monitoring schedule:
Weekly checks (all models):
- Visual inspection for leaks, unusual vibration, noise changes
- Temperature measurement at bearing housings and discharge lines
- Gauge verification (pressure, flow rate) for baseline drift
- Vibration analysis (single-shaft) and pressure ripple assessment (integrated systems)
- Ultrasonic cavitation monitoring (high-pressure models)
- Fluid sample collection for lab analysis
- Alignment verification (integrated systems)
- Relief valve functional testing
- Acoustic baseline trending
- Seal and bearing inspection during planned shutdown
- Gearbox oil sampling and analysis
- Thermal imaging of entire system
Drawing from 3G Electric's experience supporting global maintenance teams across 85+ countries, the most effective strategy combines these sensor-based diagnostics with institutional knowledge of your specific operating environment. Equipment running in high-vibration environments (marine vessels, construction sites) requires accelerated monitoring intervals. Systems operating in contaminated or corrosive environments need fluid analysis every 4-6 weeks instead of quarterly.
The transition from reactive maintenance (responding to failures) to predictive maintenance (preventing failures) typically requires 6-12 months of baseline data collection. This upfront investment delivers 300-400% ROI through reduced emergency repair costs and extended equipment service life.