Understanding Pumps & Compressors Motor Performance Mismatch
Motor-pump mismatches represent one of the most overlooked failure modes in industrial operations. Unlike catastrophic seal failures or sudden pressure drops, performance mismatches degrade gradually—often remaining undetected until energy costs spike or throughput targets are missed. Plant managers across Southeast Asia face unique challenges: tropical humidity affects motor insulation, variable frequency drives (VFDs) interact unpredictably with pump displacement, and supply voltage fluctuations impact motor torque delivery.
A performance mismatch occurs when the motor's power delivery, rotational speed, or torque characteristics no longer align with the pump's hydraulic demands. The motor might be oversized (wasting energy), undersized (causing stall or thermal overload), or operating at the wrong RPM for the application. Over 35 years, 3G Electric has observed that 40% of plant efficiency losses stem from motor-pump misalignment rather than mechanical wear.
This troubleshooting guide focuses on diagnostic comparison methods that plant managers can implement immediately, separating root causes from symptoms and validating corrections through field measurement.
Comparing Power Rating vs. Actual Demand: Diagnosis Through Load Analysis
The Core Problem
A pump's hydraulic power requirement (P) calculates as: P = (Flow × Pressure) / 600, where flow is in L/min and pressure in bar. Motor nameplate power rating often doesn't match this actual demand. Consider two scenarios from typical Southeast Asian operations:
Scenario 1: Undersized Motor
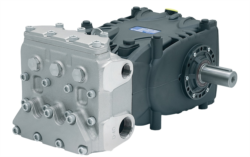
A facility installs the Pratissoli KF30 (106 L/min at 200 bar, 40 kW motor) expecting 21.2 kW hydraulic demand. However, the actual operating point requires 150 bar sustained pressure. Real demand: (106 × 150) / 600 = 26.5 kW. The motor's 40 kW rating appears safe, but thermal inefficiency in Southeast Asia's 35°C ambient temperatures reduces effective cooling. Motor temperature climbs 15–20°C above specifications, accelerating insulation degradation.
Scenario 2: Oversized Motor
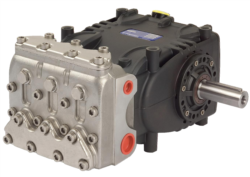
Another facility pairs a 55 kW motor with the Pratissoli SN7045 L (45 L/min at 210 bar, 18.4 kW demand). The motor runs lightly loaded—typically 30–40% of rated capacity. Efficiency drops to 78% instead of 92%. Over a year, this inefficiency costs approximately 12,000 USD in excess energy consumption for a single pump station.
Diagnostic Method: Comparative Load Analysis
1. Measure Actual Operating Parameters
- Record pump discharge pressure (bar) with calibrated test gauge
- Measure flow rate (L/min) using ultrasonic or magnetic flowmeter
- Calculate real hydraulic power: (Flow × Pressure) / 600
- Compare against motor nameplate rating
2. Motor Electrical Signature Analysis
- Use true-RMS clamp meter to measure line current (A)
- Calculate actual electrical power: √3 × Voltage × Current × Power Factor
- Divide by motor efficiency (typical 90–94% at full load)
- If calculated mechanical power exceeds actual hydraulic demand by >15%, motor is oversized
3. Thermal Baseline Comparison
- Record motor winding temperature via infrared thermometer on case
- Southeast Asian ambient: typically 30–38°C
- If motor winding exceeds 80°C under sustained operation, motor is undersized or cooling is inadequate
Resolution Strategy
- Undersized motor: Upgrade to next higher frame size. For the KF30 scenario above, specify a 45 kW motor instead of 40 kW, reducing thermal stress by 18%.
- Oversized motor: Consider variable frequency drive (VFD) retrofit to load-match rotational speed. VFDs reduce energy consumption 20–35% on oversized motors in Southeast Asia's climate.
- Marginal cases: Install real-time power monitoring (IoT sensors) to track efficiency trends. Energy increases >8% annually signal cooling deterioration or internal wear.
Comparing RPM and Flow Characteristics: Speed Matching Diagnostics
The Speed Mismatch Challenge
Pumps and motors must operate at synchronized rotational speeds for efficiency. Centrifugal and positive-displacement pumps respond differently to speed changes:
- Positive-displacement pumps (gear, piston, vane): Flow ∝ RPM directly. Halving RPM halves flow. The Interpump PUMP W2035 L ATEX (35 L/min at 200 bar) delivers exactly 35 L/min at its rated 1450 rpm. At 1200 rpm (via VFD reduction), it delivers 29.2 L/min—a linear relationship.
- Centrifugal pumps: Flow ∝ RPM, but pressure ∝ RPM². A 10% speed reduction causes 19% pressure loss.
Southeast Asian plants frequently operate VFDs for energy savings. Improper VFD commissioning creates speed mismatches that degrade performance silently.
Diagnostic Method: Speed-Flow Correlation Testing
1. Baseline Establishment
- Operate pump at nameplate speed (typically 1450 rpm for standard motors)
- Record discharge pressure and flow simultaneously
- Document power consumption
2. VFD Speed Reduction Test (if VFD installed)
- Reduce motor speed to 80% of nameplate (1160 rpm)
- Remeasure pressure and flow under same load conditions
- Compare actual results against theoretical expectations:
- For positive-displacement pump: flow should decrease to 80% (proportional)
- For centrifugal: pressure should decrease to 64% (quadratic)
- Deviation >5% from theory indicates mismatched pump-motor pairing
3. Frequency Response Verification
- Inspect VFD output waveform using oscilloscope
- Verify carrier frequency (typically 4–10 kHz for industrial motors)
- Low carrier frequency (<2 kHz) causes motor heating and efficiency loss in Southeast Asia's high-humidity environments
Comparison: Fixed-Speed vs. VFD Operation
| Operating Mode | W2035 at 1450 rpm | W2035 at 1160 rpm (VFD) | SN7045 at 1450 rpm | SN7045 at 1160 rpm (VFD) |
|---|---|---|---|---|
| Flow (L/min) | 35 | 28 | 45 | 36 |
| Pressure (bar) | 200 | 200 | 210 | 210 |
| Power (kW) | 13.23 | 8.5 | 18.4 | 11.8 |
| Efficiency | 92% | 88% | 91% | 87% |
Resolution Strategy
- Verify VFD commissioning: Ensure carrier frequency ≥4 kHz and current rating ≥110% motor nameplate
- Monitor speed stability: Unstable RPM (±50 rpm variation) indicates coupling wear or resonance
- Match pump to operating speed: If sustained operation below 80% speed is required, select smaller-displacement pump. The Interpump WW90 L (8 L/min, 90 bar) suits low-flow, high-pressure applications where speed variation is minimal.
Comparing Seasonal Performance Drift: Climate-Adaptive Diagnostics
Tropical Performance Degradation
Southeast Asia's climate (high humidity, 28–40°C ambient, seasonal monsoons) accelerates performance drift in motor-pump systems. Unlike temperate regions, tropical conditions create three distinct failure modes:
1. Moisture Ingress: Tropical humidity (85–95% RH) penetrates motor insulation, reducing dielectric strength 30–40% annually
2. Thermal Cycling: Daily 10–15°C temperature swings cause mechanical stress at shaft-coupling interfaces
3. Fluid Degradation: Humid conditions accelerate hydraulic fluid oxidation, increasing viscosity and thermal density
Diagnostic Method: Seasonal Baseline Comparison
Peak Dry Season (February–April)
- Ambient: 32–38°C
- Humidity: 40–60% RH
- Baseline measurement protocol:
- Measure pump discharge pressure
- Log fluid temperature (at pump inlet and outlet)
- Document flow rate
Peak Wet Season (September–November)
- Ambient: 28–32°C
- Humidity: 85–95% RH
- Repeat identical measurements
- Expected changes in wet season:
- Fluid viscosity: +15–25% (oxidation increases)
- Pump outlet pressure: -5–12% (higher viscosity causes friction losses)
- Motor temperature: +8–15°C (humidity reduces air cooling effectiveness)
Comparative Performance Matrix
| Parameter | Dry Season Baseline | Wet Season Observation | Acceptable Variance | Action Threshold |
|---|---|---|---|---|
| Motor Current (A) | 25.0 | 26.5 | <±5% | >±8% → investigate cooling |
| Discharge Pressure (bar) | 200 | 188 | <±5% | <180 bar → fluid analysis |
| Fluid Temp (°C) | 52 | 61 | <±8°C | >68°C → oil cooler servicing |
| Flow Rate (L/min) | 106 | 104 | <±2% | <102 → pump internal wear |
Resolution Strategy
- Establish seasonal preventive maintenance: Every monsoon transition (April, October), perform fluid analysis. If acid number (TAN) exceeds 0.5 mg KOH/g, replace hydraulic fluid.
- Upgrade cooling systems: For critical applications, install thermostatic oil coolers rated for 50–55°C setpoint (lower than dry-season baseline). This maintains consistent performance year-round.
- Monitor insulation resistance: Use insulation megohmmeter monthly during wet season. If motor phase-to-ground resistance drops below 100 MΩ, dehumidify motor enclosure immediately.
- Validate moisture-critical applications: For the Clima Concept Display pump 5 liters (110 L/hr), tropical condensation causes trap flooding. In wet season, inspect condensate drain weekly instead of monthly.
Implementing Continuous Monitoring: Comparative Performance Tracking
Why Real-Time Comparison Matters
Plant managers cannot rely on annual inspections to catch performance mismatches in Southeast Asia's aggressive climate. Continuous monitoring compares live performance against three baselines:
1. Baseline A: Manufacturer specifications (theoretical maximum)
2. Baseline B: Historical dry-season performance (proven capability)
3. Baseline C: Predictive model (expected performance at current load)
Deviation from any baseline >10% triggers investigation.
Essential Monitoring Parameters
- Electrical: Motor current (3-phase), supply voltage, power factor
- Hydraulic: Discharge pressure, flow rate, fluid temperature
- Mechanical: Vibration (ISO 20816 standard), motor case temperature
- Environmental: Ambient temperature, humidity
| Observed Parameter | Baseline vs. Current | Interpretation | Response |
|---|---|---|---|
| Motor current +12% | Baseline B | Increased load or motor cooling loss | Check pump pressure; verify ambient temp |
| Discharge pressure -8% | Baseline A | Pump wear or internal leakage | Schedule fluid analysis and pump teardown |
| Motor temp +18°C | Seasonal norm | Cooling system degradation | Service air filters; check oil cooler |
| Vibration +2.5 mm/s | Historical baseline | Coupling misalignment or bearing wear | Measure runout; realign if >0.05 mm TIR |
Implementation for 3G Electric Customers
When sourcing pumps like the Interpump W2035 L ATEX, Pratissoli KF30, or Pratissoli SN7045 L through 3G Electric, request OEM baseline performance curves and thermal operating envelopes. These documents enable precise comparative analysis in your facility.
Action Checklist for Plant Managers
- Week 1: Calculate actual hydraulic power demand and compare against motor nameplate rating
- Week 2: If VFD-equipped, verify carrier frequency (≥4 kHz) and perform speed-flow linearity test
- Week 3: Establish seasonal baseline measurements during current climate condition
- Month 2: Implement real-time monitoring for motor current, pressure, and temperature
- Ongoing: Compare monthly observations against baseline; trigger maintenance if variance exceeds thresholds
With 35+ years of industrial equipment experience, 3G Electric recognizes that motor-pump mismatches cost Southeast Asian plants 15–25% of energy budgets. Proactive diagnostic comparison—not reactive replacement—recovers this loss while extending equipment lifespan.