Introduction: Moving Beyond Reactive Maintenance
Industrial Pumps & Compressors represent critical investments in production systems, yet many maintenance teams still operate on reactive failure protocols rather than condition-based strategies. With over 35 years of experience as a global industrial equipment distributor, 3G Electric has observed that organizations implementing systematic condition monitoring reduce unplanned downtime by 40-60% while extending equipment lifespan by 25-35%.
Condition monitoring transforms maintenance from cost-center reactivity into predictive intelligence. Rather than waiting for catastrophic failure, your team monitors real-time equipment health signals—vibration, temperature, fluid composition, and performance metrics—to schedule maintenance during planned downtime windows. For Singapore's competitive manufacturing and HVAC sectors, this operational discipline directly impacts profitability and system availability.
This article provides maintenance teams with practical protocols for implementing condition-based monitoring on Pumps & Compressors systems, enabling data-driven replacement and repair decisions.
Section 1: Vibration Analysis and Mechanical Diagnostics
Understanding Vibration as a Health Indicator
Vibration analysis is the primary early warning system for Pumps & Compressors degradation. Unlike temperature or pressure readings that respond to acute failures, vibration signatures reveal developing mechanical issues weeks or months before catastrophic breakdown.
Industrial pumps operate with precise mechanical tolerances. As components degrade—bearing wear, impeller imbalance, cavitation erosion, or shaft misalignment—they generate characteristic vibration frequencies that deviate from baseline signatures. Your maintenance team captures these deviations through accelerometers, converting mechanical motion into electrical signals analyzed by condition monitoring software.
Baseline and Trend Monitoring Protocol
Establish baseline vibration measurements during equipment commissioning or during a known good-condition service window. Document overall vibration velocity in mm/s and capture full frequency spectra (0-5 kHz minimum). Store this baseline as your reference standard.
Schedule monthly vibration measurements at identical sensor positions:
- Pump discharge side (horizontal, vertical, and axial planes)
- Motor/drive coupling location
- Foundation mounting points
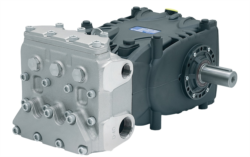
For critical systems like the Pratissoli KF30 (106 L/min, 40 kW) or Pratissoli MW40 (211 L/min, 85 kW), establish weekly trending during the first 500 operating hours to verify stable baseline before relaxing to monthly intervals.
Trend analysis—plotting vibration values over time—reveals degradation rates. A gradual 2-3% monthly increase indicates normal wear; sudden spikes (>10% in single measurement) suggest acute bearing damage, cavitation, or seal failure requiring immediate inspection.
ISO 10816 and Equipment Classification
Reference ISO 10816-3 (industrial machines with rated power 15-75 kW mounted on rigid foundations) and ISO 10816-1 (large rotating machines >15 kW). These standards define four vibration zones:
- Zone A (≤2.3 mm/s): Unrestricted long-term operation
- Zone B (2.3-7.1 mm/s): Acceptable; schedule maintenance within next service interval
- Zone C (7.1-11.2 mm/s): Unacceptable for continuous operation; plan remedial action within days
- Zone D (>11.2 mm/s): Dangerous; immediate shutdown and inspection required
Zone B crossover typically indicates bearing preload loss, impeller erosion, or minor misalignment—all addressable through planned maintenance rather than emergency repair.
Section 2: Fluid Analysis and Chemical Condition Monitoring
Hydraulic and Lubrication Fluid as Diagnostic Medium
Fluid condition directly reflects internal component health. Metallic wear particles, oxidation byproducts, water ingress, and viscosity degradation all appear in fluid chemistry before mechanical failure manifests in vibration or temperature data.
Implement quarterly fluid sampling protocol for critical Pumps & Compressors systems:
Sampling best practices:
- Extract samples during mid-shift operation (fluid at thermal equilibrium)
- Use dedicated sample bottles—never reuse containers
- Sample from system circulating loop (not reservoir surface where settling occurs)
- Maintain chain-of-custody documentation for trending
1. Viscosity at 40°C and 100°C – Indicates oxidation and thermal stability. A 10% viscosity increase signals oxidation; >15% increase requires fluid replacement regardless of hours-to-change recommendation
2. Total Acid Number (TAN) – Measures organic acid accumulation from oxidation. TAN increase >1.0 mg KOH/g indicates oxidation saturation; immediate fluid replacement required to prevent component corrosion
3. Particle Count (ISO 4406 code) – Trending particle counts (>4 µm, >6 µm, >14 µm) reveals bearing/pump wear rates. Sudden 50% particle count increase in single sample indicates acute wear requiring investigation
4. Water Content (Karl Fischer titration) – Exceeding 500 ppm signals seal failure or environmental contamination; >1000 ppm causes hydraulic fluid emulsification and pump cavitation. Compact systems like Interpump E1D1808 L operating at 180 bar are particularly sensitive to water ingress
5. Ferrous Content (ICP analysis) – Iron concentration trending distinguishes normal wear (gradual increase) from bearing cage failure or pump internals degradation (exponential increase)
Establishing Alert Thresholds
Work with your fluid supplier to establish equipment-specific alert thresholds based on pump type and application. For example:
- KF30 series: TAN alert at 1.5 mg KOH/g; particle count alert at ISO 18/16/13
- MW40 series: TAN alert at 1.2 mg KOH/g due to higher operating pressure (210 bar); water content alert at 250 ppm
- Compact gear pumps (E1D1808, ET1C1612): Water alert at 300 ppm due to higher contamination sensitivity
Document threshold decisions and include rationale (baseline fluid condition, environment, criticality) in your maintenance management system.
Section 3: Temperature and Thermal Management
Thermal Monitoring as Secondary Confirmation
While vibration and fluid analysis provide early warning, temperature monitoring confirms system stress and validates diagnoses. Elevated discharge temperatures often correlate with increased internal leakage (seal wear), viscous shearing (fluid degradation), or load increases (system demand creep).
Implement non-contact infrared thermography monthly on critical systems:
- Pump discharge manifold (target area within 100 mm of fluid outlet)
- Motor/coupling housing
- Return line filter head
Establish baseline discharge temperature during normal operation. For most industrial hydraulic systems, baseline discharge temperature ranges 45-55°C under standard load. Document both ambient temperature and system load state when recording baseline.
Temperature Trending and Diagnosis
Temperature increases of 5-8°C above baseline, sustained over multiple measurements, indicate:
- Increasing internal leakage (worn pump internals or valve spools)
- Fluid viscosity drift (oxidation or water contamination)
- System demand increase (load growth requiring pressure/flow adjustment)
Temperature spikes >10°C above baseline suggest acute problems:
- Cavitation (inlet supply restriction or low fluid level)
- Blockage (clogged inlet filter or suction line)
- Stuck relief valve (system pressure holding excessive load)
When thermal data conflicts with vibration data—high temperature but normal vibration—suspect internal leakage rather than mechanical wear. Fluid analysis confirming viscosity increase or TAN elevation supports this diagnosis; recommended action is fluid replacement with inlet system inspection.
Thermal Management and Cooler Sizing
For systems operating consistently above 55°C discharge temperature, evaluate heat exchanger capacity. Modern industrial Pumps & Compressors generate significant thermal load:
- Pratissoli SS71153 (122 L/min, 37.5 kW) can generate 15-18 kW waste heat at full system pressure (160 bar)
- Pratissoli MW40 (211 L/min, 85 kW) generates 20-25 kW waste heat
Under-sized cooling capacity causes sustained temperature elevation, accelerating fluid oxidation and reducing component lifespan by 30-40%. Engage 3G Electric for cooler capacity verification if baseline discharge temperatures consistently exceed 55°C.
Section 4: Performance Trending and System Load Analysis
Establishing Performance Baselines
Beyond mechanical condition, monitor system performance parameters that indicate functional degradation:
- Discharge pressure at constant load – Pressure creep indicates internal pump leakage or relief valve spool wear
- Flow rate at constant speed – Flow reduction indicates pump displacement loss from cavitation damage, impeller erosion, or internal leakage
- Power input at constant output – Increased motor current at fixed flow/pressure indicates mechanical friction increase (bearing degradation) or fluid viscosity rise
Document these parameters during commissioning and monthly thereafter. Many modern VFD drives log current and power automatically; export this data monthly for trending analysis.
Pressure Creep Protocol
If system pressure increases 5-10 bar at constant load over 2-3 months, suspect relief valve spool stiction or pilot stage degradation. This is early warning for relief valve maintenance or replacement:
1. Record pressure reading under measured load condition
2. Isolate relief valve; measure opening pressure directly
3. If opening pressure exceeds setting by >5 bar, initiate relief valve service or replacement
4. If opening pressure matches setting, suspect downstream check valve leakage; inspect and replace as needed
For high-pressure systems like Interpump E1D1808 L (180 bar) or Interpump ET1C1612 (160 bar), relief valve performance directly impacts system safety and component longevity. Schedule annual relief valve calibration verification for safety-critical applications.
Load Trend Analysis and Capacity Planning
Systems often experience gradual load growth—additional production lines, increased cycle rates, or system pressure increases to compensate for aging components. Plot monthly average operating pressure and flow over 12-24 months.
Linear pressure growth >2 bar/month or flow growth >3 L/min/month suggests:
- Demand increase requiring pump displacement upgrade or parallel pump installation
- System degradation (relief valve creep, cooler fouling, filter restriction) requiring corrective maintenance
Proactive load trending prevents surprise capacity failures and enables planned equipment upgrades rather than emergency installations.
Implementation Roadmap for Your Facility
Phase 1: Foundation (Month 1-2)
- Identify critical Pumps & Compressors systems (production impact >$5,000/hr downtime)
- Establish baseline vibration, fluid analysis, and thermal measurements
- Document equipment specifications, operating parameters, and maintenance history
Phase 2: Measurement System (Month 2-4)
- Install permanent vibration sensors on critical equipment or establish portable measurement locations
- Establish fluid sampling protocol with laboratory (ISO certification required; most Malaysian and Singaporean hydraulic suppliers offer ISO 4406 analysis)
- Configure thermal imaging schedule and train staff on non-contact measurement techniques
Phase 3: Trending and Alert System (Month 4-6)
- Implement spreadsheet or dedicated condition monitoring software (even Excel-based trending outperforms no trending)
- Define equipment-specific alert thresholds based on baseline data
- Establish monthly measurement schedule and document responsibility
Phase 4: Predictive Action (Month 6+)
- When alerts trigger, initiate root-cause investigation combining vibration, fluid, and thermal data
- Schedule planned maintenance based on condition trends rather than calendar intervals
- Document corrective actions and outcomes to refine future alert thresholds
With 35 years of experience supporting industrial operations, 3G Electric has observed that facilities achieving Phase 4 typically reduce unplanned downtime by 50-60% and extend critical equipment lifespan by 25-35%—ROI typically achieved within 18-24 months through reduced emergency repairs and extended service intervals.
Conclusion
Condition monitoring transforms Pumps & Compressors maintenance from reactive crisis management into strategic asset management. By systematically tracking vibration signatures, fluid composition, thermal profiles, and performance parameters, your maintenance team gains early warning of developing issues—enabling planned interventions during production downtime rather than catastrophic failures during peak operation.
Implement condition monitoring progressively, starting with vibration and fluid analysis on your most critical systems. The data discipline builds institutional knowledge about your specific equipment and operating environment, enabling increasingly precise maintenance decisions and extending equipment lifespan while reducing total cost of ownership.
Contact 3G Electric for condition monitoring equipment recommendations, fluid analysis laboratory partnerships, and maintenance protocol development tailored to your specific Pumps & Compressors applications.