Introduction: From Reactive to Predictive Maintenance
Pumps & Compressors represent some of the most critical—and most vulnerable—assets in industrial facilities. Unlike static equipment, these machines operate continuously under variable loads, temperatures, and fluid conditions. Traditional maintenance schedules based on calendar intervals often miss the real degradation patterns that matter.
Since 1990, 3G Electric has supplied industrial equipment to Southeast Asian manufacturers, and we've observed a clear trend: plants that implement condition monitoring reduce unplanned downtime by 40–60% and extend equipment lifespan by 25–35%. This article provides plant managers with a structured approach to monitoring pumps and compressors before they fail.
Section 1: Core Condition Indicators and What They Tell You
Vibration Analysis as Your Primary Diagnostic Tool
Vibration is the earliest and most reliable warning signal. Every pump and compressor has a natural vibration signature based on its design, speed, and load. Deviations from baseline indicate emerging problems.
Key vibration metrics:
- Overall vibration velocity (measured in mm/s): Normal range for most industrial pumps is 2–7 mm/s. Values above 11 mm/s suggest bearing wear, misalignment, or cavitation.
- Frequency analysis: High-frequency vibrations (above 5 kHz) indicate bearing defects. Low-frequency spikes point to imbalance or looseness.
- Acceleration trending: A steady increase over weeks or months signals progressive deterioration before catastrophic failure.
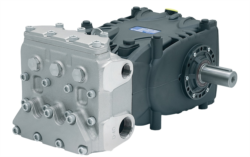
For example, the Pratissoli KF30 operating at rated 106 L/min should maintain consistent vibration signatures. When you detect a 20–30% increase in overall velocity, you've identified a maintenance window—typically 2–4 weeks before failure.
Practical implementation:
Install permanent accelerometers on pump bearing housings and motor feet. Take baseline readings during commissioning. Monitor weekly via wireless sensor networks; most industrial facilities can achieve this with €2,000–€5,000 in sensor hardware plus cloud-based trending software.
Temperature Trending and Thermal Load Interpretation
Temperature rise indicates internal friction and fluid degradation. Unlike vibration, temperature changes develop more slowly, making them excellent for 7–14 day advance warning.
Critical temperature points:
- Discharge line temperature: Should remain within ±10°C of baseline. If your Pratissoli MW40 (85 kW) normally runs at 58°C discharge, a climb to 68–70°C signals fluid viscosity breakdown or internal leakage.
- Motor winding temperature: Exceeding 90°C (for Class F insulation) accelerates degradation. Most failures occur at 110°C+.
- Bearing housing temperature: Should not exceed ambient + 40°C. Higher readings indicate friction from wear or inadequate lubrication.
Monitoring setup:
Thermocouples or RTD sensors at discharge, bearing, and motor locations cost €30–€150 per point. Connect to your SCADA or PLC to trigger alerts at 65°C for discharge, 85°C for bearings. Log data continuously; trending software will identify rate-of-change patterns that predict failure windows.
Pressure and Flow Degradation Signatures
Under constant load, pressure and flow curves should be stable. Drift indicates wear or internal leakage.
What to measure:
- Suction pressure drop: A 0.3 bar increase over baseline suggests inlet filter clogging or impeller wear.
- Discharge pressure loss: On a Pratissoli SS71153 rated for 160 bar, a 5–10 bar unexplained drop indicates seal or valve leakage.
- Flow rate at constant pressure: Use inline turbine or magnetic flowmeters. A 10% reduction suggests impeller erosion or cavitation damage.
Section 2: Data Collection Architecture and Diagnostic Workflows
Building Your Monitoring System
Effective condition monitoring requires three layers:
Layer 1: Real-time sensors
- Vibration accelerometers (±10% accuracy, 0–10 kHz bandwidth)
- Temperature sensors at 3+ critical points per pump/compressor
- Pressure transducers (suction, discharge, case drain if applicable)
- Flow meters on primary discharge lines
- Industrial IoT gateway (typically your existing PLC or a dedicated condition monitoring unit) that calculates trending metrics every 15–60 minutes
- Local storage buffer (7–30 days) to prevent data loss during network interruptions—critical in tropical humidity environments where wireless reliability varies
- Cloud dashboard ingesting 4–8 data points per pump/compressor
- Automated alerts for threshold exceedances (vibration, temperature, pressure)
- Trending analysis to detect rate-of-change patterns (e.g., "vibration increasing 0.5 mm/s per week")
- Sensor hardware per pump: €800–€2,500 (depending on sensor count and IP rating for humid environments)
- Edge controller and gateway: €1,500–€3,500
- Annual cloud/software license: €400–€1,200 per pump
- Technician training (critical—monitoring fails without skilled interpretation): 40–80 hours
Diagnostic Decision Tree for Plant Managers
When alerts trigger, follow this workflow:
If vibration increases 25%+ in one week:
1. Check pressure and temperature for abnormalities. Isolated vibration rise suggests mechanical issue (bearing, balance, coupling alignment).
2. Review recent operating history: New product run? Higher speeds? Changed fluid batch?
3. Schedule bearing inspection or alignment check within 5–10 days.
4. If vibration is high-frequency (>3 kHz), prioritize bearing replacement; if low-frequency, focus on alignment.
If discharge temperature rises 8–12°C over baseline:
1. Check suction pressure and inlet filter condition. High suction vacuum indicates air ingestion or clogging.
2. Review discharge pressure. Sustained overpressure (5%+ above setpoint) causes heat. Adjust regulator or check downstream restrictions.
3. Monitor fluid viscosity. Request oil analysis from your supplier (viscosity, acid number, particle count). High acid number indicates fluid breakdown.
4. Timeline: Fluid change likely needed within 7–14 days.
If pressure drops 5–8% while flow remains constant:
1. Verify inlet conditions first. Suction cavitation causes pressure loss and noise.
2. Check discharge filter pressure differential. Clogged filter restricts flow and masks pump efficiency loss.
3. Request impeller condition inspection at next maintenance.
4. Timeline: Schedule maintenance within 10–20 days; pump is losing efficiency but functional.
If flow drops 8%+ at constant pressure:
1. This is most serious—indicates internal leakage from seal wear or valve stiction.
2. Vibration and temperature will likely be normal or rising slightly.
3. Schedule overhaul or replacement immediately; efficiency is below 85% and continuing degradation is rapid.
Section 3: Maintenance Planning Integration and Asset Life Optimization
Extending Equipment Life Through Targeted Interventions
Condition data allows you to schedule maintenance precisely when return-on-investment is highest.
Predictive maintenance windows:
Instead of calendar-based servicing (e.g., "change oil every 2,000 hours"), shift to condition-based intervals. For industrial pumps operating 4,000–6,000 hours annually:
- If fluid analysis shows acid number <2.0 and particle count
- If vibration is steady at baseline and temperatures are normal, defer seal replacement from scheduled 5-year interval to 6–7 years.
- If a compressor shows early-stage bearing wear (elevated high-frequency vibration but no critical threshold) detected at 3-year mark, plan bearing replacement at next planned shutdown instead of emergency outage.
- Unplanned failure downtime: €3,200/hour (lost production + emergency labor). A 6-hour outage = €19,200.
- Planned maintenance shutdown: €800 labor + €2,000 parts + €1,500 production loss = €4,300.
- Predictive monitoring investment (sensors + 3-year analytics): €4,500.
- ROI: One prevented failure pays for 4+ years of monitoring.
Integration with Spare Parts and Vendor Coordination
Condition monitoring data should inform procurement planning:
1. Lead-time visibility: When your monitoring system predicts bearing replacement needed in 8–12 weeks, order now—don't wait for emergency stock.
2. 3G Electric partnership: As your equipment distributor for 35+ years, we can supply critical spares (e.g., KF30 bearing kits, Interpump E1D1808 L seal assemblies, ET1C1612 SX*D20 repair kits) with 2–3 week lead times. Condition data helps you avoid 2-day expedite fees.
3. Vendor coordination: Share trending data with equipment manufacturers. They can often provide design bulletins or software updates that address emerging wear patterns.
Seasonal Considerations for Tropical Operations
Singapore's humid, warm climate affects pump and compressor reliability:
- Monsoon periods: Increased ambient temperature (often 32–35°C) elevates baseline discharge temperatures by 3–5°C. Adjust alert thresholds seasonally to avoid false positives.
- Humidity and corrosion: High moisture accelerates internal rust on steel pump bodies and motor laminations. Condition data showing rising friction temperatures in high-humidity weeks suggests moisture ingress; schedule preventive seal inspection.
- Thermal cycling: Air-conditioned plant sections experience condensation when equipment idles. Ensure breather filters are desiccant-type; monitor for rust in case drains.
Section 4: Implementing Your First Condition Monitoring Program
Phased Rollout Strategy
Phase 1 (Weeks 1–4): Critical asset baseline
- Install sensors on your 2–3 most critical pumps/compressors (those with longest lead times for replacement or highest production impact).
- Establish 2–4 week baseline of normal operation at various loads.
- Train maintenance technician on alert response.
- Add 4–6 secondary assets based on failure history or age.
- Refine alert thresholds based on Phase 1 data. Initial thresholds from equipment specifications are often too conservative.
- Integrate with your CMMS (Computerized Maintenance Management System) to auto-generate work orders when alerts trigger.
- Monitor all significant rotating equipment. For most Singapore plants, this is 8–15 units.
- Establish quarterly data review meetings (plant manager, maintenance lead, 3G Electric technical contact) to identify systemic issues (e.g., "all compressors showing discharge temperature rise in August—check ambient cooling capacity").
- Use trending data to justify capital budget for replacement: "KF30 unit has exceeded 20,000 hours; bearing wear trending indicates replacement in next 6 months; recommend replacement this fiscal year."
Key Performance Indicators to Track
Measure the success of your program:
1. Unplanned downtime hours per year: Target reduction from baseline to <2% of total operating hours.
2. Mean time between failures (MTBF): Track for each asset; aim for 15%+ improvement within 12 months.
3. Maintenance cost per operating hour: Should decrease as emergency repairs and overtime decline.
4. Equipment lifespan extension: Document any assets that surpass original design life due to proactive maintenance.
5. Alert accuracy: Of 100 alerts generated, how many result in actionable maintenance findings? Target >70%. False positives waste technician time and erode program credibility.
Partnering with 3G Electric for Implementation Support
With 35 years of experience supplying industrial equipment across Asia, 3G Electric provides:
- Technical specification review: Confirm sensor selection matches your specific pump/compressor models (KF30, MW40, E1D1808 L, ET1C1612 SX*D20, SS71153)
- Commissioning support: On-site baseline establishment and technician training
- Spare parts availability: Bearings, seals, and impellers stocked or available within 2–3 weeks for most industrial pump families
- Trend analysis guidance: Review your 6–12 month data quarterly to refine strategies
Conclusion
Condition monitoring for pumps and compressors transforms maintenance from a cost center focused on failure response into a strategic function that extends asset life, reduces emergency downtime, and improves capital planning. Plant managers who implement this approach see returns within 12–18 months and develop a competitive advantage through operational reliability.
Begin with your most critical assets, establish baseline data methodically, and refine alert thresholds through experience. With 3G Electric's equipment expertise and your plant's operational knowledge, you'll build a monitoring program that pays for itself many times over across your equipment fleet's lifecycle.