Understanding Measurement & Detection in Condition-Based Maintenance
Measurement & Detection represents far more than simply reading gauges and displays. It's the systematic capture of equipment operating parameters that reveal the health status of your industrial assets before failure occurs. For maintenance teams managing complex machinery across global operations, the ability to detect subtle changes in pressure, temperature, electrical current, and other critical parameters is the difference between planned maintenance and emergency shutdowns.
With over 35 years of experience as an industrial equipment distributor, 3G Electric has worked with thousands of maintenance teams across diverse industries. We've observed that organizations implementing comprehensive measurement and detection strategies reduce unexpected equipment failures by 40-60% and extend asset service life by 25-35%. This isn't theoretical—it's the practical outcome of understanding what your equipment is telling you through precise instrumentation.
Condition-based maintenance relies on three fundamental measurement principles: establishing baseline parameters for normal operation, monitoring variations in real-time, and recognizing trend patterns that indicate developing problems. Unlike time-based maintenance schedules that assume all equipment deteriorates at the same rate, condition-based approaches respond to actual equipment condition, optimizing maintenance timing and resource allocation.
Section 1: Establishing Baseline Measurements and Normal Operating Parameters
Every piece of industrial equipment operates within a specific range of normal parameters. Your first task as a maintenance team is documenting what "normal" looks like for each critical system. This baseline becomes your reference point for all future measurements and the foundation of effective condition monitoring.
Creating Your Equipment Baseline
Begin by documenting equipment specifications from manufacturers' literature, design documents, and historical performance records. For pressure systems, record the normal operating pressure ranges. For thermal systems, document standard operating temperatures under various load conditions. For electrical equipment, establish normal current draw patterns. This baseline documentation should include:
- Normal operating parameters under standard load conditions
- Acceptable variance ranges (typically ±5-10% for most industrial applications)
- Parameter ranges during startup, normal operation, and shutdown
- Seasonal or cyclical variations in normal operation
- Historical performance data from at least one complete operational cycle
Using instruments like the Preciman Green ABS pressure gauge D100 0/+1bar G1/2 for pneumatic system monitoring or the Preciman ABS manometer axial D63 0/+16bar G1/4 for more demanding hydraulic applications, establish initial pressure baselines across your system network. Record these measurements under identical load and environmental conditions—always at the same time of day if possible, and always with consistent operator technique.
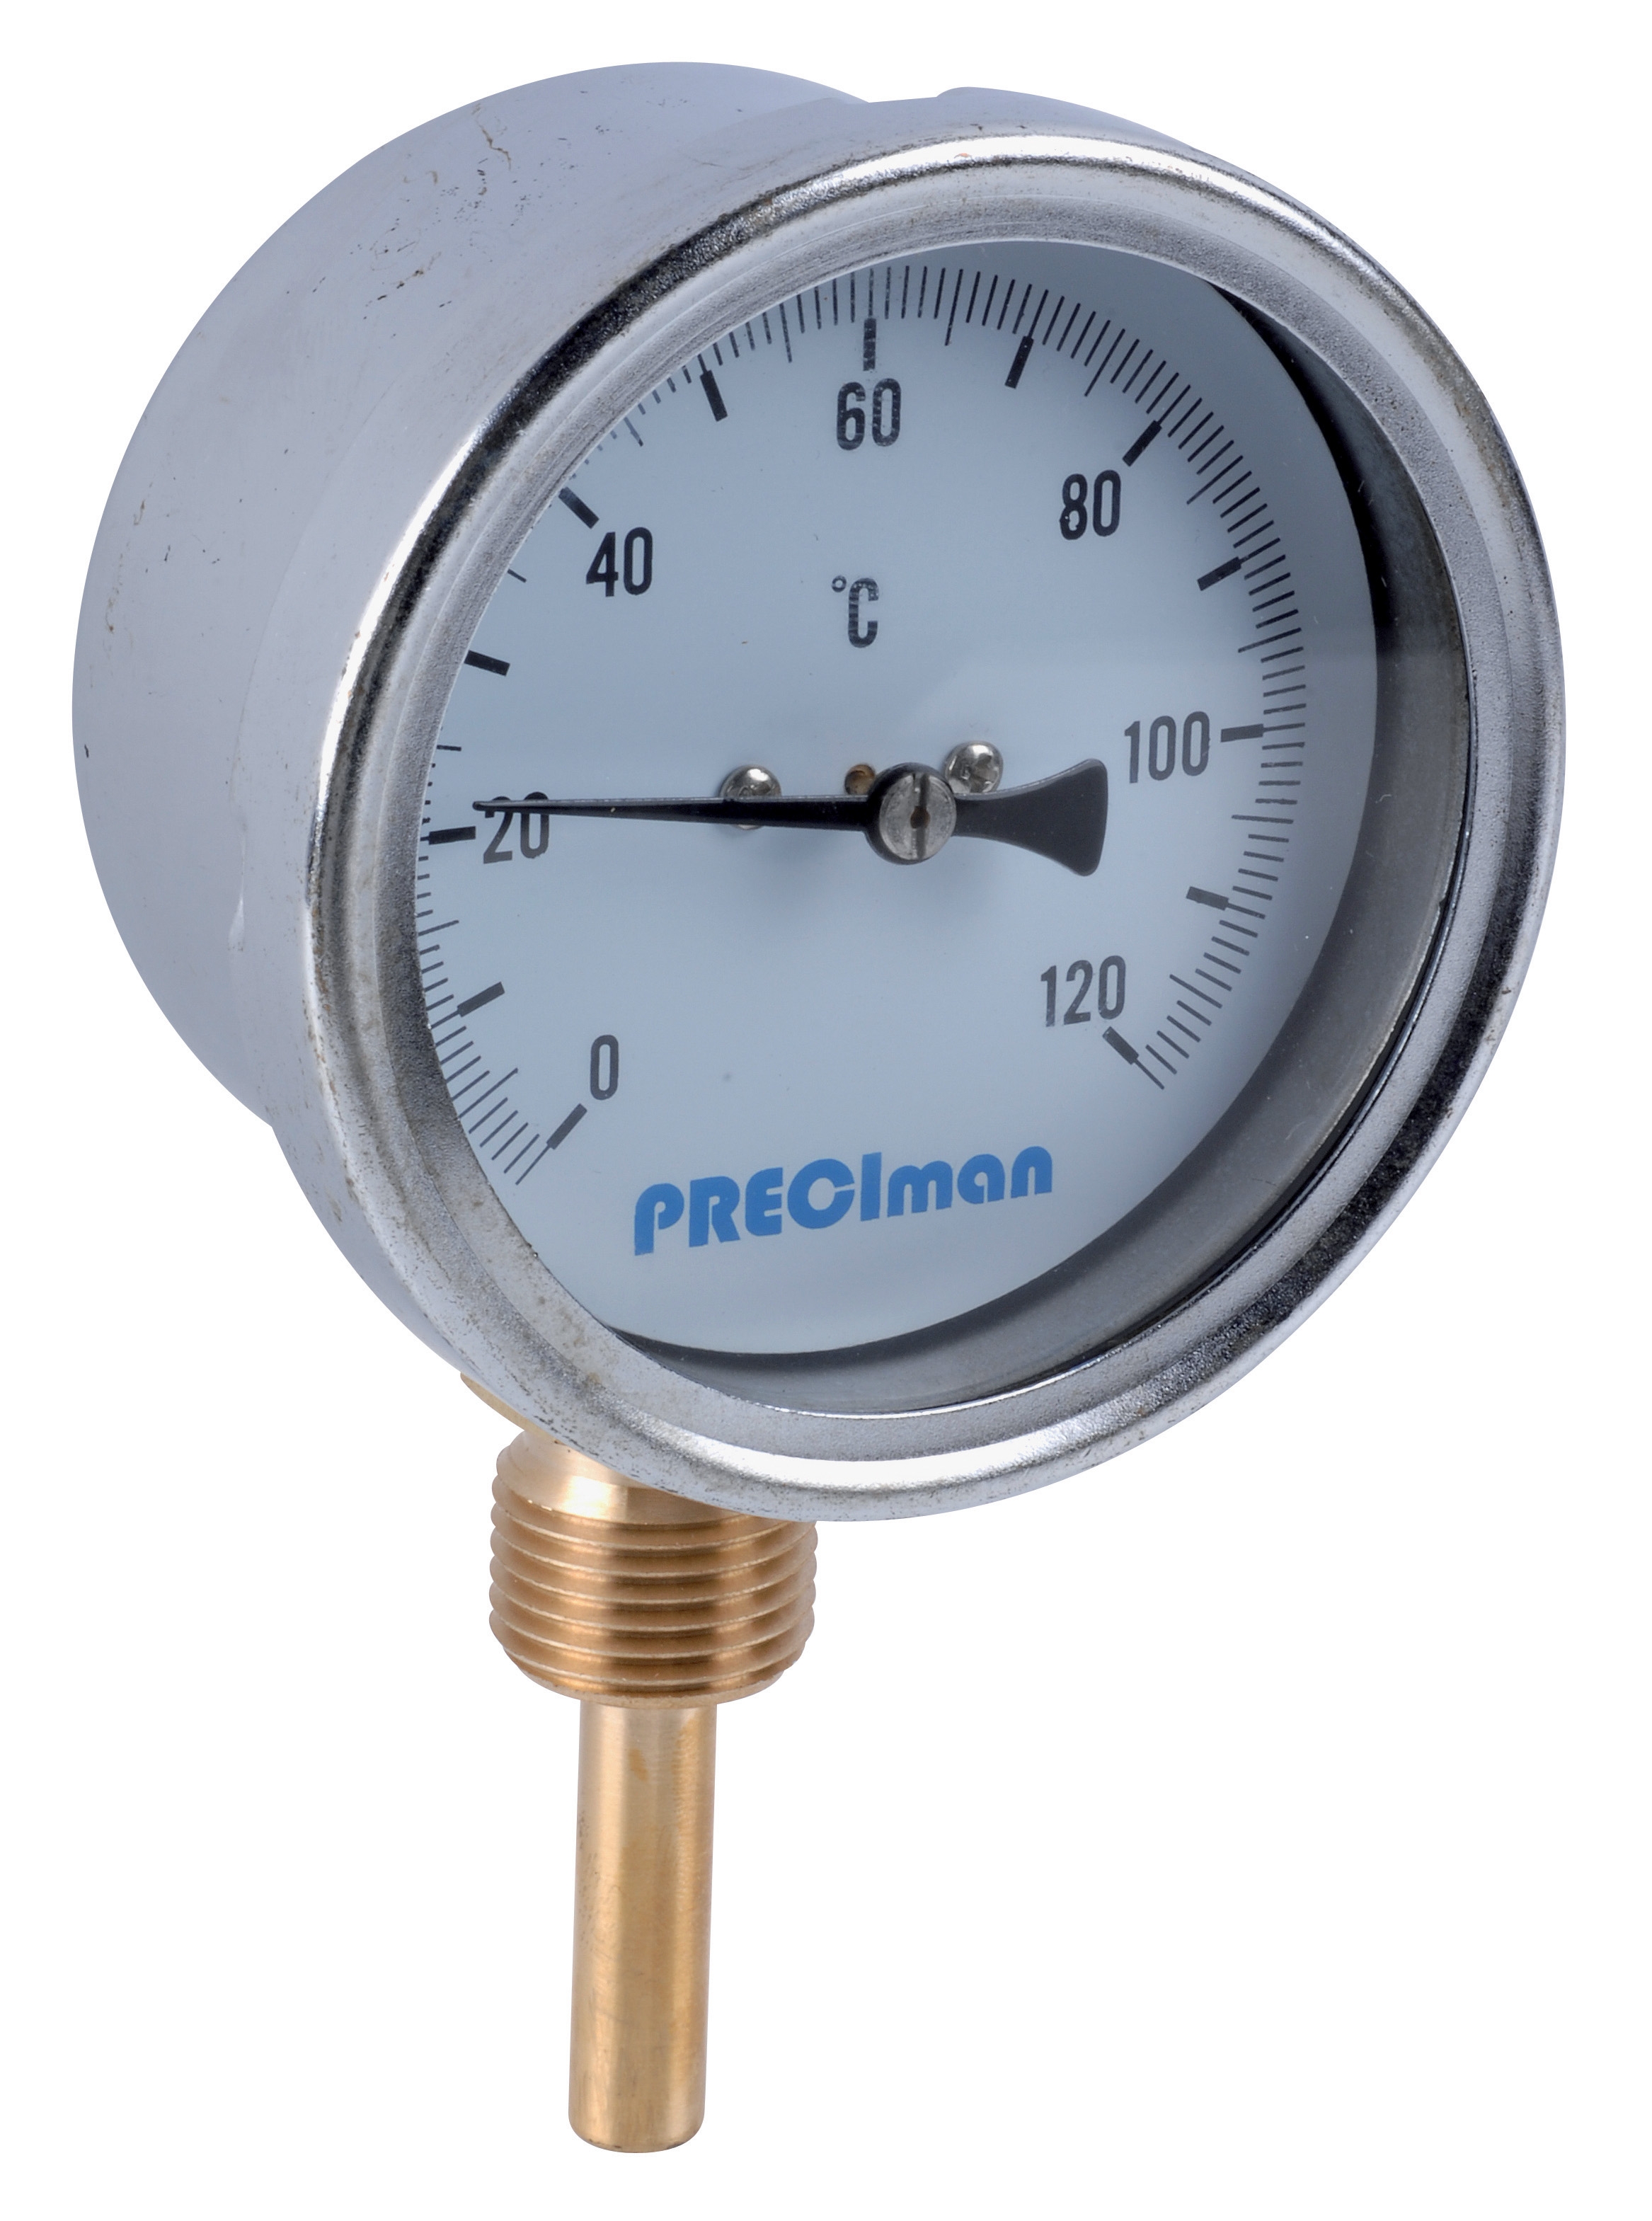
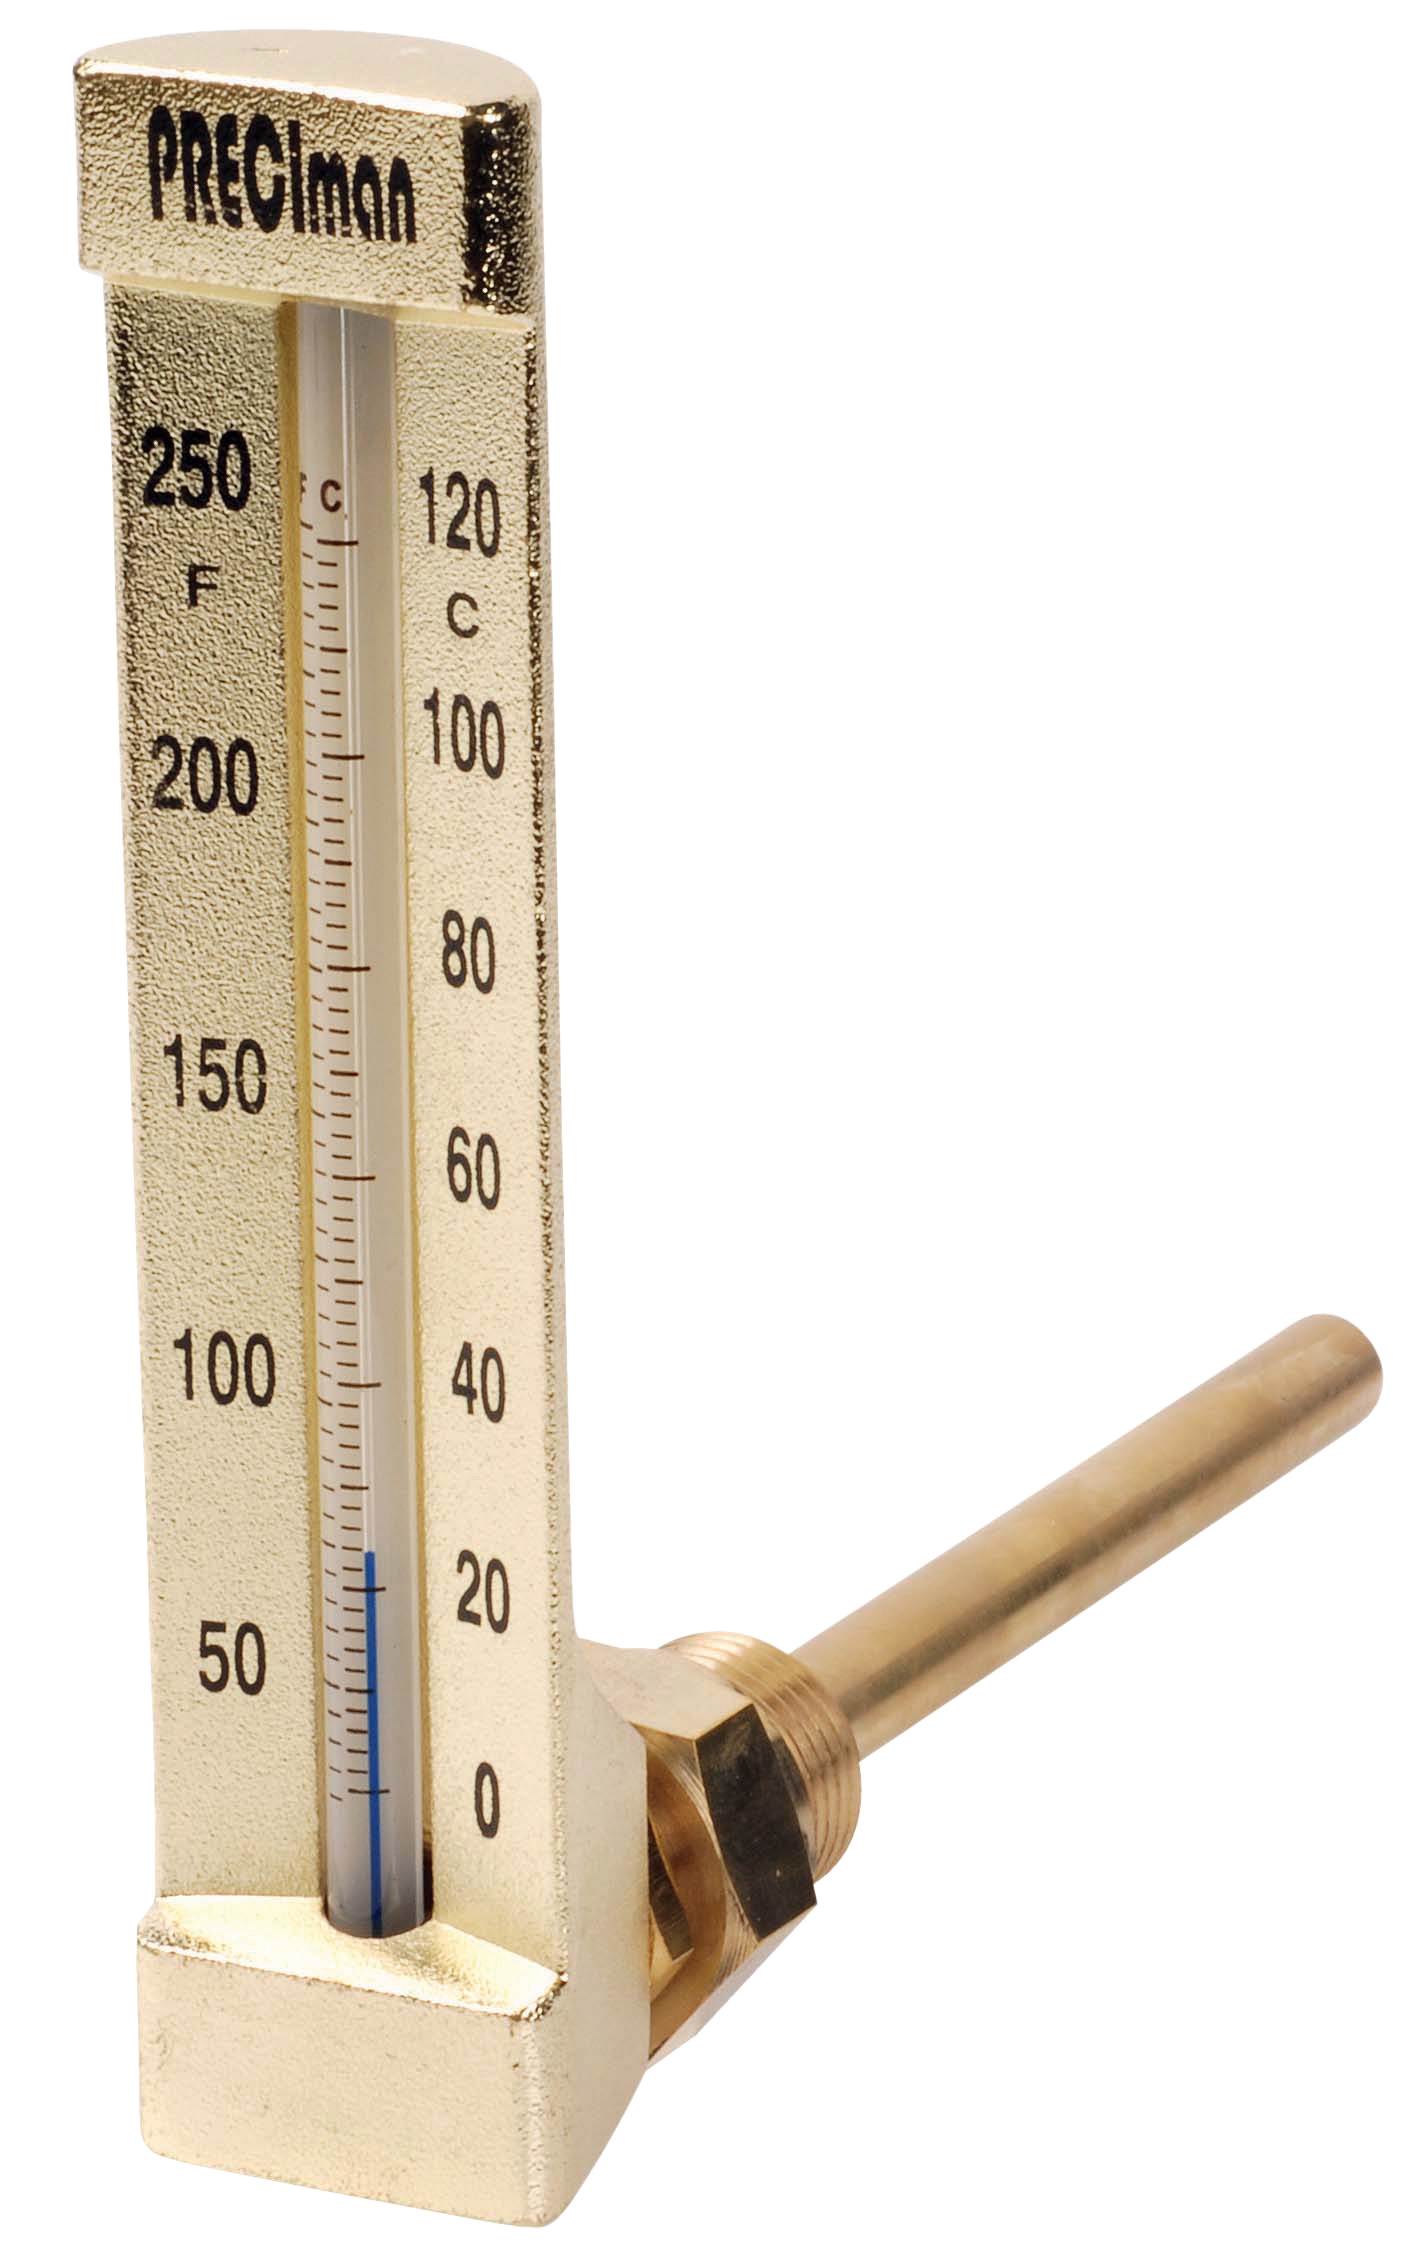
Temperature baselines deserve equal attention. The Preciman Green vertical thermometer D80 -30/+50°C L 10cm with thermowell and Preciman Industrial thermometer 0/+50°C immersion probe 100 elbow height 200 allow you to establish thermal profiles across different system zones. A bearing operating at 65°C under normal conditions becomes a concern at 85°C, but only if you've documented what normal looks like.
For electrical systems, current detection forms a critical baseline. The Dwyer Miniature current detector MCS-111001 with its adjustable setpoints and 0.01 A minimum detection capability enables you to establish normal current draw patterns for motors, control circuits, and power distribution systems. Document the current signature of healthy equipment—these signatures reveal developing problems before obvious symptoms appear.
Documenting and Organizing Baseline Data
Create a standardized baseline documentation sheet for each equipment item. Include:
- Equipment identification and location
- Manufacturer specifications and design parameters
- Initial measurement date and environmental conditions
- Normal operating parameter ranges
- Critical warning thresholds (where intervention becomes necessary)
- Measurement frequency recommendations based on equipment criticality
Store this documentation in a centralized, accessible location—whether digital database, maintenance management software, or physical files. The goal is ensuring every technician can quickly reference what normal operation looks like for any equipment they're troubleshooting.
Section 2: Real-Time Monitoring and Trend Analysis for Predictive Detection
Once baselines are established, real-time monitoring becomes your early warning system. The most damaging failures aren't sudden—they're preceded by measurable changes that progress over days, weeks, or months. Your role is detecting these changes early enough to schedule corrective action before failure occurs.
Implementing Systematic Measurement Routines
Establish measurement schedules based on equipment criticality and failure mode characteristics. High-criticality equipment driving production output or supporting safety-critical functions requires frequent measurement intervals—potentially daily or multiple times per week. Standard industrial equipment might require weekly or bi-weekly measurements. Lower-risk systems might use monthly or quarterly intervals.
For each measurement point, document:
- Date and time of measurement
- Actual measured value
- Operating conditions (load percentage, ambient temperature, system runtime)
- Technician identification and instrument used
- Variance from baseline and acceptable range
- Preliminary observations (unusual sounds, vibration, visual indicators)
When using pressure measurement instruments across your facility, the standardized gauges like the Preciman Green ABS pressure gauge and Preciman ABS manometer axial ensure consistent, comparable readings. Their ±2.5% accuracy provides the precision necessary to detect meaningful changes—variations of 5-10% that might indicate developing pump wear, seal degradation, or valve problems.
Temperature monitoring through consistent use of instruments like the Preciman Green vertical thermometer reveals thermal degradation patterns. A gradual temperature increase in a bearing or motor winding often precedes mechanical or electrical failure by weeks or months. A sudden temperature spike might indicate friction increase from bearing wear or blocked cooling passages.
Electrical current monitoring using tools like the Dwyer Miniature current detector reveals motor and equipment loading changes. Increasing current draw under constant load indicates rising friction or mechanical resistance. Decreasing current draw might suggest mechanical disconnection or bearing seizing. Current signature changes reveal developing faults in motor windings or control circuits.
Recognizing Significant Trends
Trend analysis separates meaningful changes from normal fluctuation. A single reading 8% above baseline might be nothing—environmental temperature variation, temporary load increase, or measurement technique variation. Three consecutive readings showing a 2-3% increase trend, however, indicates developing degradation requiring investigation.
Key trend patterns to monitor:
- Gradual drift: Slow, steady increases or decreases over weeks indicating wearing components (pump wear, bearing degradation)
- Cyclic patterns: Repeating variations corresponding to operational cycles—normal unless the pattern amplitude increases
- Sudden shifts: Abrupt changes indicating new conditions—mechanical disconnection, valve malfunction, sensor issues
- Increasing volatility: Readings that become increasingly variable suggesting mechanical looseness or control instability
- Plateau changes: Previously stable parameters shifting to new stable level suggesting permanent equipment change
Document trend patterns in your maintenance management system. Create simple trend charts—even hand-drawn graphs on measurement sheets help technicians visualize patterns. Most developing failures show measurable trends 4-12 weeks before critical failure, providing adequate planning time for maintenance scheduling.
Section 3: Diagnostic Investigation and Root Cause Detection
When measurements indicate deviation from baseline or concerning trends, systematic investigation becomes necessary. This is where measurement and detection transitions from monitoring to diagnostic troubleshooting.
Expanding Measurement Points for Problem Isolation
When a single measurement suggests trouble, expand your measurement network to isolate the root cause. A high-pressure reading in a hydraulic system might result from:
- Pump excessive discharge (measure pump inlet and outlet separately)
- Restrictor or filter blockage downstream (measure pressure at multiple points along the flow path)
- Valve malfunction (measure pressure upstream and downstream of suspected valve)
- Measurement error (verify with alternate instrument or repeated measurement)
Using multiple precision instruments from your facility's instrumentation inventory ensures you're measuring system behavior accurately. The Preciman ABS manometer with G1/4 connection readily integrates into pneumatic and hydraulic test points, allowing you to measure pressure at various system locations and build a complete system pressure profile.
Temperature diagnostics similarly benefit from expanded measurement. If thermal monitoring reveals an elevated temperature zone, measure that location along with adjacent areas to identify the source. Is the problem localized to a specific bearing, or does it span a wider zone suggesting circulation or insulation issues?
Electrical current investigations using the Dwyer Miniature current detector might involve measuring current at motor input, output, and specific phase combinations to detect single-phase conditions, winding problems, or load imbalances. Current trending in combination with temperature monitoring creates a complete picture of motor health.
Measurement-Guided Corrective Actions
Measurements don't just identify problems—they guide your corrective response. Measurement data helps you determine:
- Urgency level: Gradually trending problems can be scheduled into planned maintenance; approaching critical thresholds require immediate action
- Scope of work: Measurement patterns often indicate specific failure modes, guiding which components need attention
- Success verification: Post-repair measurements confirm corrective actions resolved the underlying issue
- Root cause confirmation: Progressive measurement data through the diagnostic process often reveals which suspected cause is actually responsible
For pressure-related issues, measurement trending guides whether you're addressing pump wear (gradual pressure loss over weeks), valve stiction (sudden pressure changes with sluggish response), or filter blockage (pressure increasing while flow decreases). Each diagnosis suggests different corrective action.
For thermal issues, comparing temperature changes at different locations guides diagnostics. Localized bearing temperature increase suggests lubrication problems or bearing wear. Distributed temperature increase suggests reduced cooling or environmental factors. Rising winding temperature in motors might indicate electrical overload or ventilation blockage.
Section 4: Building Organizational Measurement Competency
Implementing effective measurement and detection programs requires more than purchasing instruments. Your maintenance team needs training, standardized procedures, and organizational commitment.
Technician Training and Skill Development
Every technician measuring equipment parameters should understand:
- Proper instrument operation and zero-point verification
- Correct connection and isolation procedures for pressure measurements
- Temperature measurement probe placement and immersion depth for accurate readings
- Current measurement safety procedures and clamp-on technique
- How measurement uncertainty affects trend analysis (±2.5% accuracy means a reading of 10 bar ±0.25 bar)
- Common measurement errors and how to verify accuracy
Rotate measurement responsibilities among qualified technicians to build redundancy. If only one person understands your pressure measurement program, equipment failure during their absence creates risk.
Standardized Procedures and Documentation
Create written measurement procedures for each critical equipment type. These should specify:
- Measurement location and access procedure
- Measurement frequency and scheduling
- Acceptable normal operating ranges
- Warning thresholds requiring investigation
- Escalation procedures when measurements exceed acceptable limits
- Documentation format and storage location
Standardization ensures measurement consistency regardless of which technician performs the work. Different technicians measuring the same system should obtain identical results (within instrument accuracy limits).
Integration with Maintenance Management
Measurement and detection data should directly feed your maintenance planning and scheduling. When measurements indicate developing problems, work orders should automatically generate for diagnostic investigation and corrective maintenance. This integration transforms raw measurement data into actionable maintenance intelligence.
Compare actual maintenance intervals to planned intervals. Are you scheduling maintenance at appropriate times—early enough to prevent failure but not so early that components still have service life remaining? Measurement data guides these optimizations.
Continuous Program Improvement
Review your measurement program quarterly. Which equipment types are you catching problems in early? Which failures are still occurring unexpectedly? This analysis reveals whether measurement frequency is adequate, whether your warning thresholds are appropriately set, or whether you're missing measurement points that could provide earlier warning.
With 35 years of experience supporting maintenance operations globally, 3G Electric has learned that successful measurement and detection programs evolve continuously. What works for your facility in year one should improve based on your experience in years two and three. Equipment-specific measurement strategies, threshold adjustments, and frequency optimization based on actual failure patterns create increasingly effective condition monitoring programs.