Understanding Measurement & Detection in Predictive Maintenance
Measurement & Detection systems form the foundation of modern predictive maintenance programs. Rather than waiting for equipment to fail, maintenance teams can now identify degradation patterns through continuous monitoring of critical parameters like temperature, pressure, electrical properties, and system pressure. With over 35 years of experience distributing industrial equipment globally, 3G Electric has helped maintenance teams across dozens of industries transition from reactive to predictive maintenance strategies.
The shift toward predictive maintenance represents a fundamental change in how industrial facilities approach equipment care. By detecting subtle changes in equipment behavior, maintenance teams can schedule interventions during planned downtime rather than experiencing emergency shutdowns. This approach reduces overall maintenance costs, extends equipment lifespan, and improves operational reliability. The economic benefits are substantial: predictive maintenance typically reduces maintenance costs by 25-30% while reducing unplanned downtime by up to 45%.
Core Measurement Parameters for Equipment Health Monitoring
Temperature Monitoring: The Primary Health Indicator
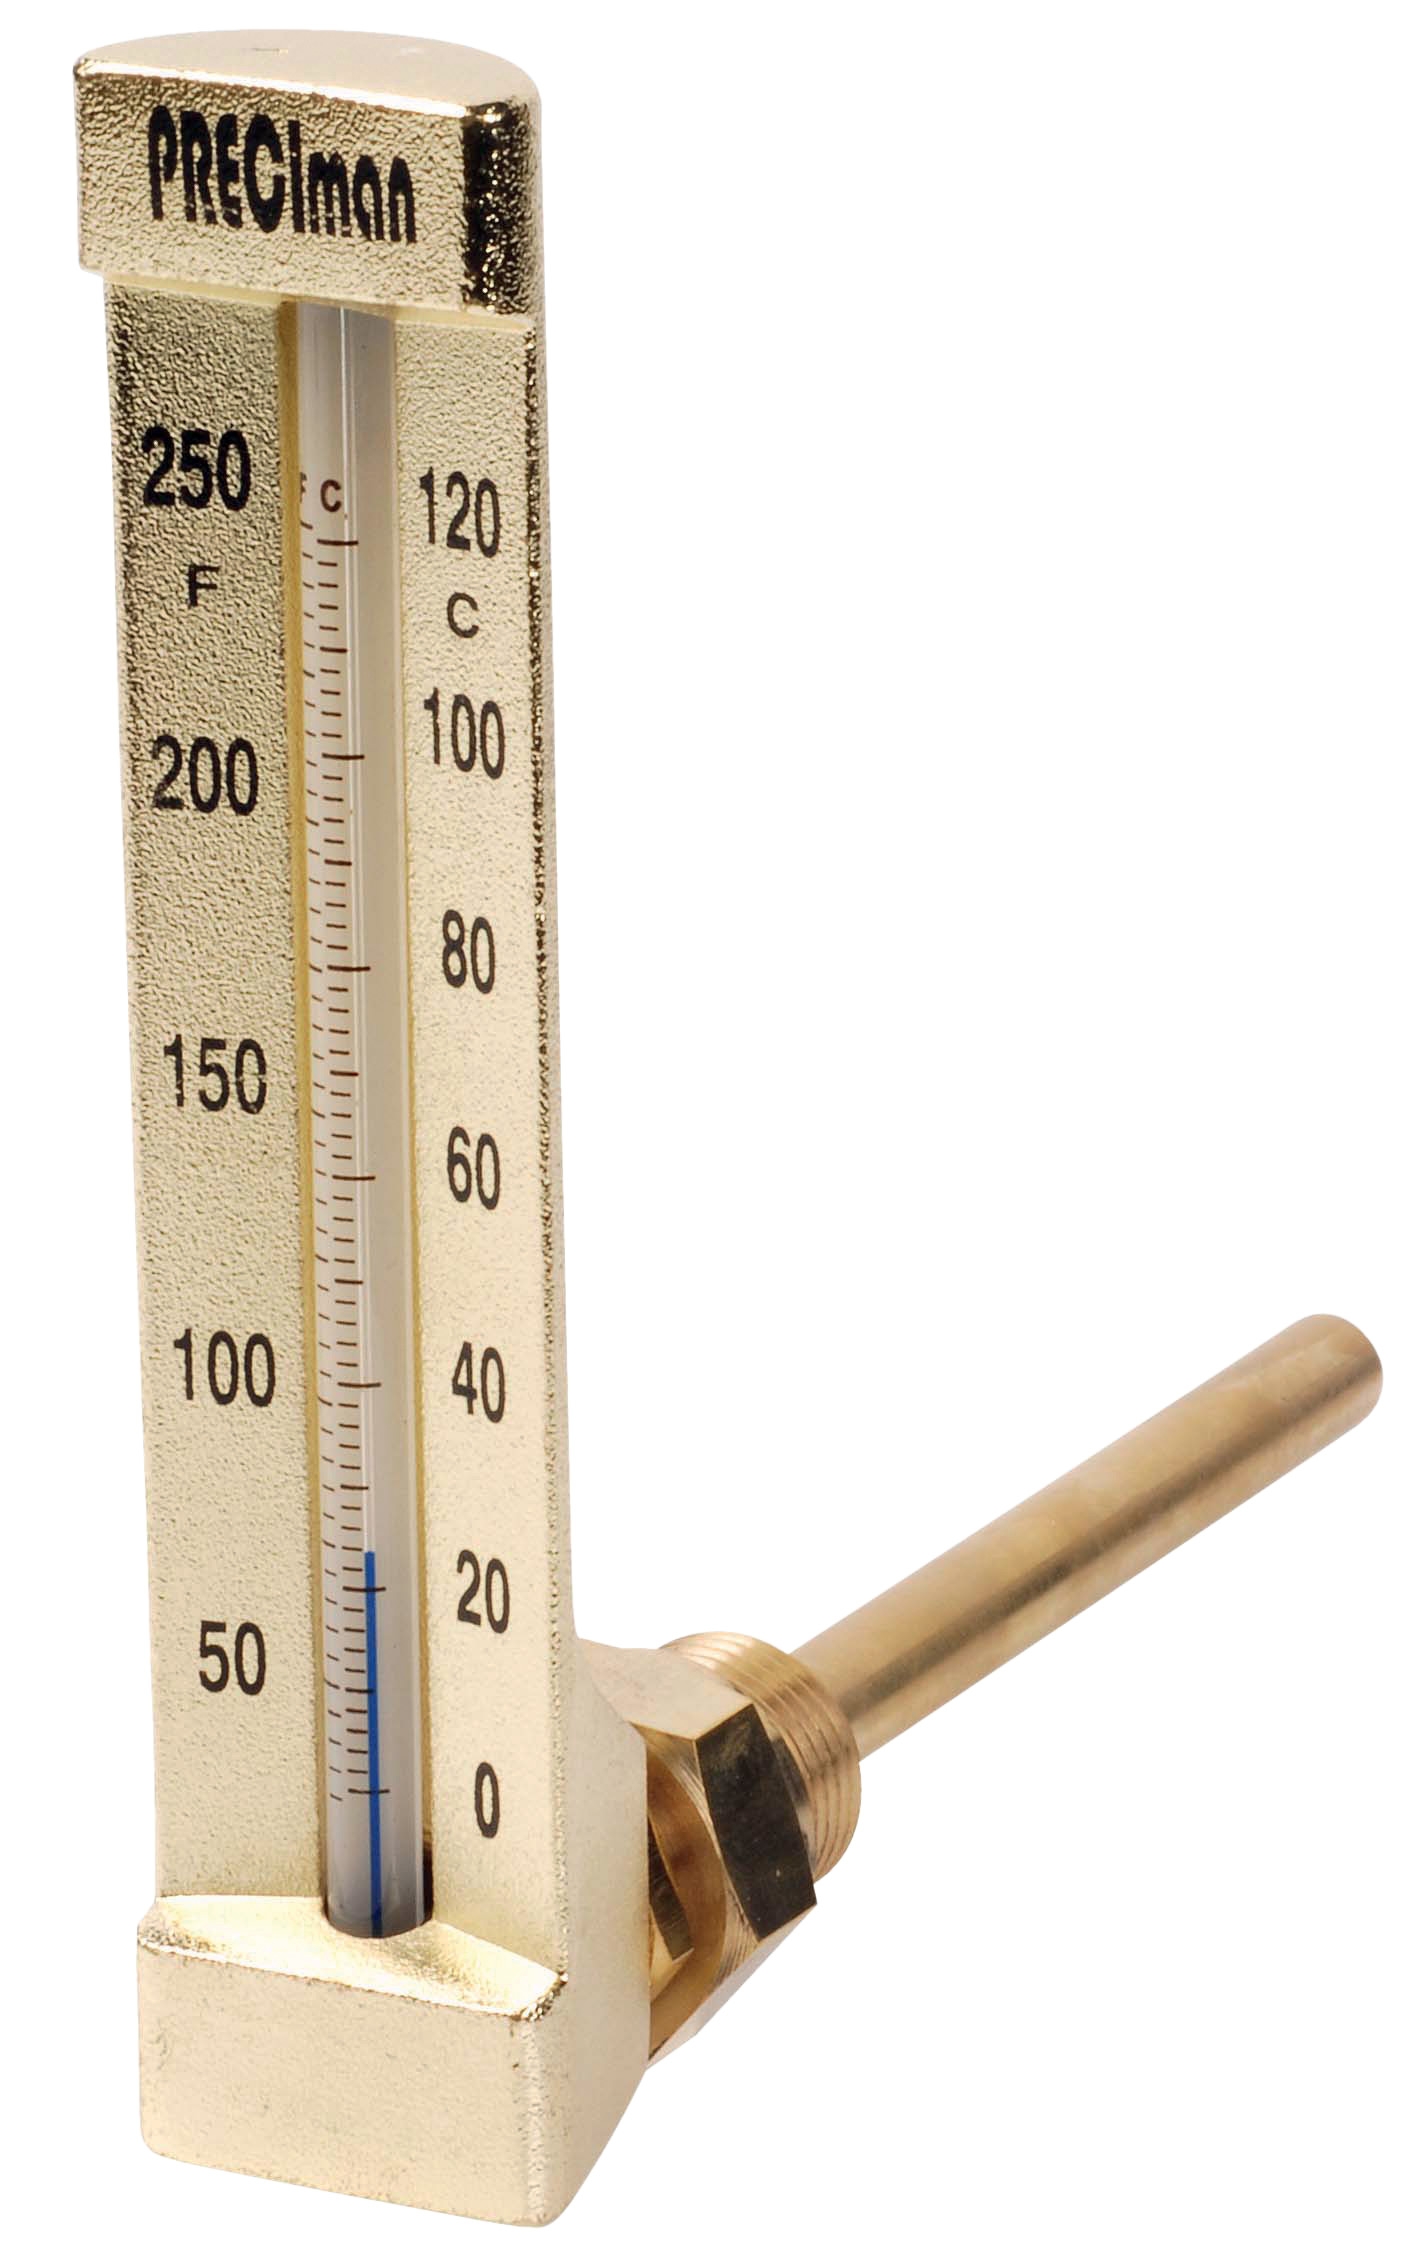
Temperature is often the first indicator of equipment distress. Excessive heat signals bearing wear, friction, electrical faults, or fluid degradation. Maintenance teams need reliable thermometers strategically placed throughout their systems to establish baseline temperatures and detect anomalies.
For immersion temperature measurement in industrial systems, the CBM Industrial thermometer 0/+50°C immersion 63 right angle height 150 provides direct fluid contact measurement with robust construction suitable for harsh environments. The 90-degree angle configuration allows installation in confined spaces where vertical mounting isn't possible.
For critical system monitoring requiring larger display visibility, the CBM Green vertical thermometer D80 -30/+50°C L 10cm with thermowell offers a wider temperature range and larger dial for easier reading from distance. The thermowell design protects the sensing element from direct fluid contact, extending instrument life and simplifying maintenance.
For applications requiring compact precision measurements, the CBM Axial thermometer D65 -40/+40°C L5cm with thermowell delivers accurate readings in tight spaces. This model's wider temperature range (extending to -40°C) makes it ideal for cooling systems and climate-controlled facilities.
Best Practice: Establish temperature baselines during normal operation, then set alert thresholds at 10-15% above baseline. Gradual temperature increases indicate progressive wear; sudden spikes suggest acute problems requiring immediate investigation.
Electrical Properties and System Integrity
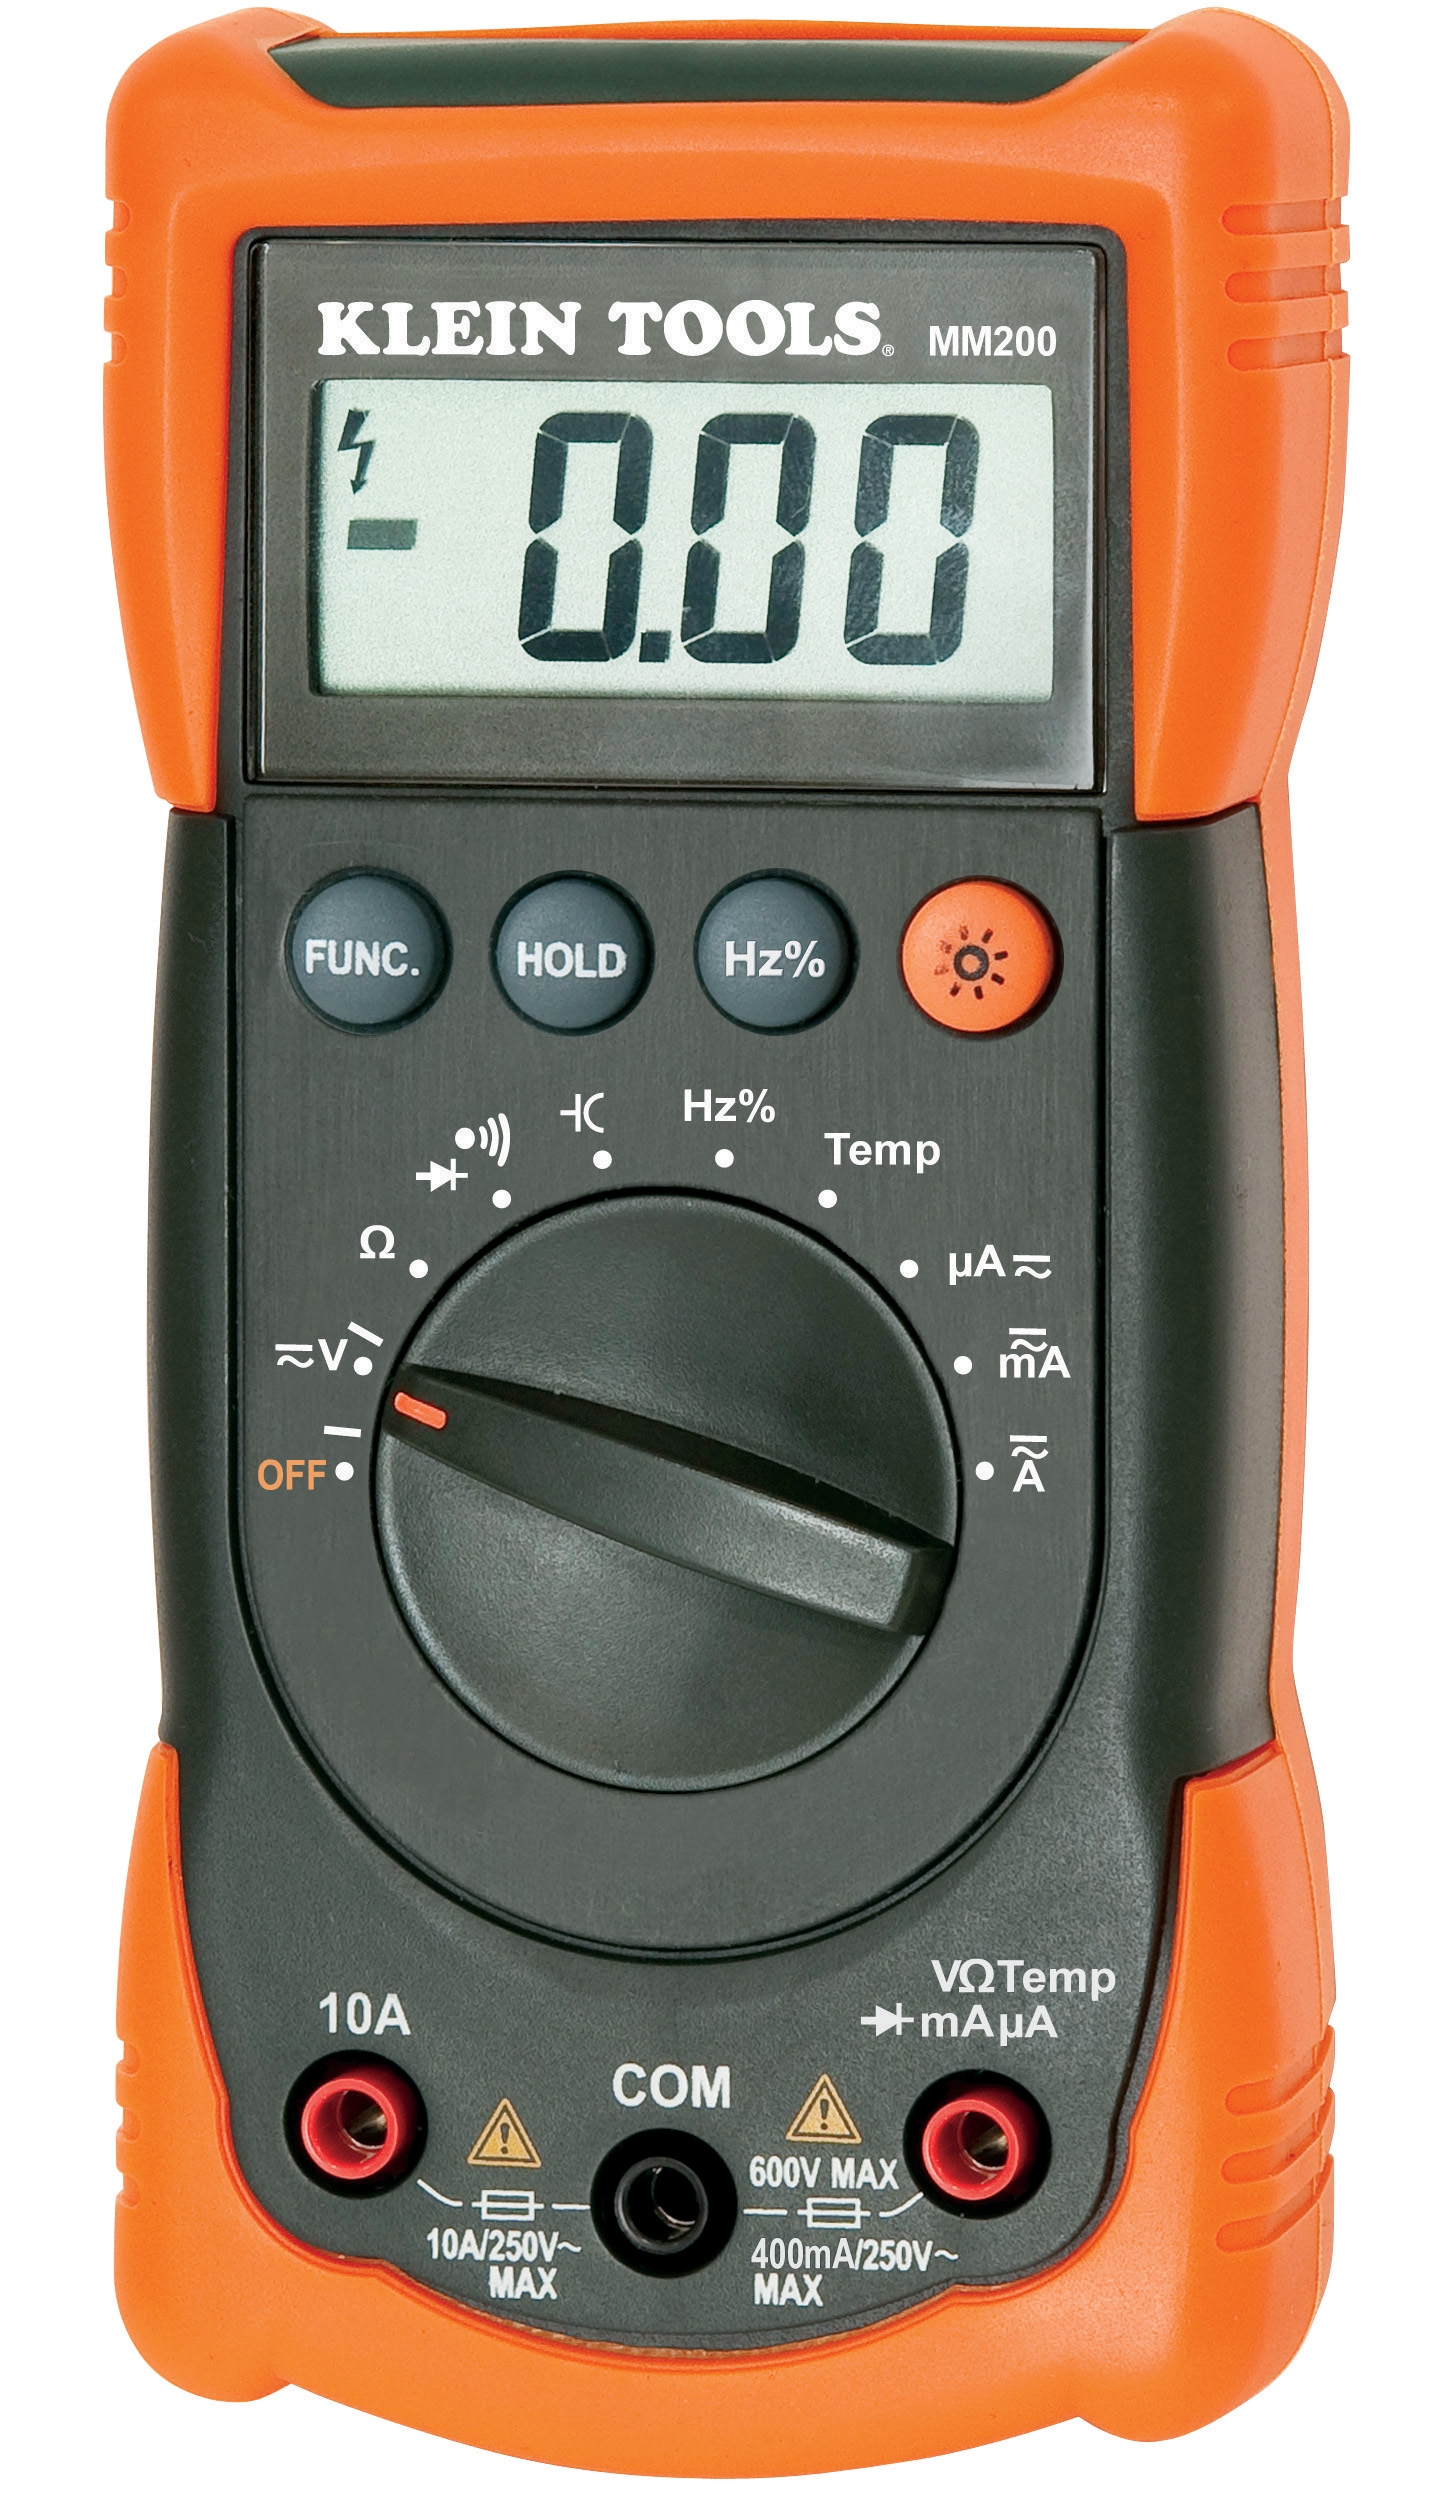
Beyond temperature, electrical measurements reveal problems invisible to thermal monitoring. Voltage fluctuations, current imbalances, and resistance changes precede most electrical equipment failures. The CBM Automatic multimeter MM420 enables maintenance teams to measure AC/DC voltage, current, resistance, and continuity—the fundamental parameters needed for electrical diagnostics.
Regular multimeter measurements establish electrical baselines for motors, transformers, and control systems. Deviations from baseline values often appear 4-8 weeks before catastrophic failure, providing crucial intervention windows. Many maintenance teams use weekly or bi-weekly electrical spot-checks on critical equipment as an early-warning system.
System Pressure Integrity
Pressure stability in hydraulic, pneumatic, and expansion tank systems indicates proper operation and safety. Pressure drops suggest leaks, while unexpected pressure increases indicate blockages or seal degradation. Maintaining proper expansion tank pressurization is critical for closed-loop heating and cooling systems.
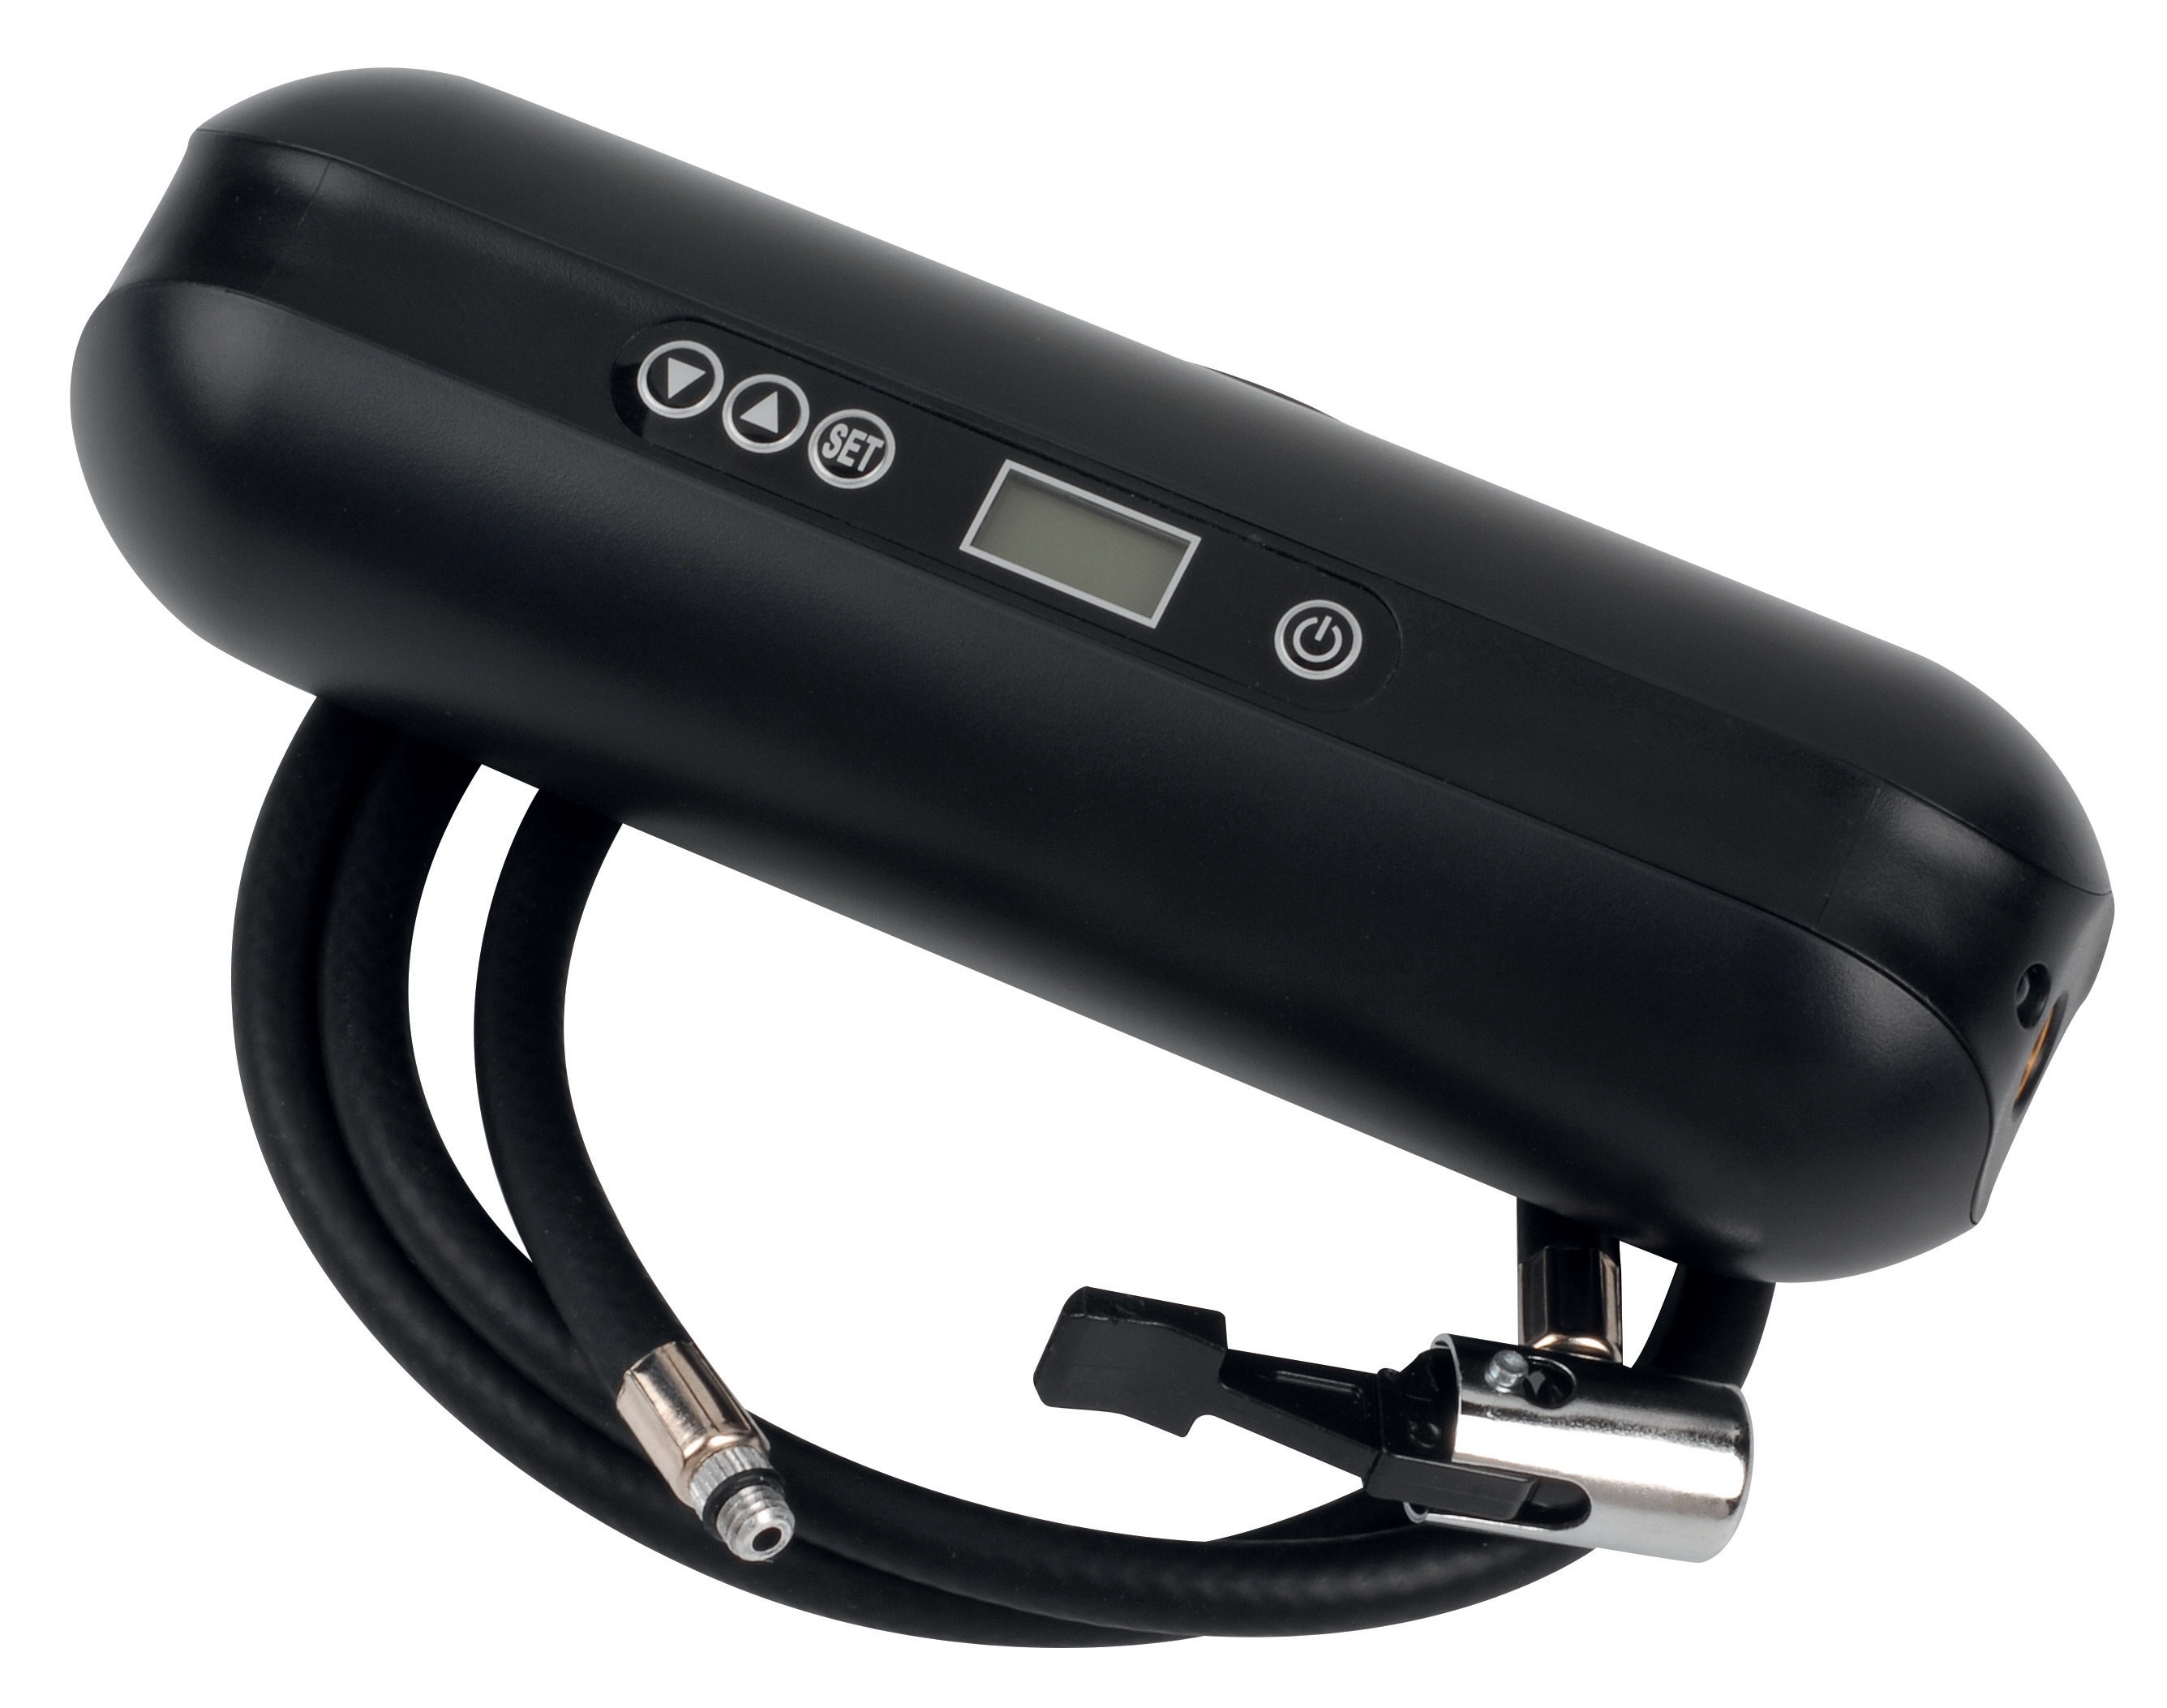
The CBM Expansion tank inflator battery 2000 mAH allows maintenance teams to quickly verify and adjust expansion tank precharge pressure without system shutdown. Proper precharge pressure prevents tank failure and maintains system efficiency. This portable tool eliminates the need for external compressors or shop visits for expansion tank maintenance.
Critical Application: Monthly expansion tank pressure checks prevent catastrophic tank failures that can damage entire heating systems. The CBM inflator's 2000 mAH battery provides sufficient charge for 50+ pressure cycles before requiring recharge.
Implementation Strategy: Building Your Measurement & Detection Program
Phase 1: Baseline Documentation
Before implementing predictive maintenance, establish comprehensive baseline data on all critical equipment. This involves:
- Recording temperature readings under normal operating conditions (morning, midday, evening)
- Measuring electrical parameters on all motors and power circuits
- Documenting pressure readings for hydraulic, pneumatic, and thermal systems
- Creating equipment-specific measurement logs with date, time, and operator initials
Baselines typically require 2-4 weeks of daily measurements to account for operating cycles and seasonal variations. This data becomes your reference point for detecting meaningful changes.
Phase 2: Strategic Sensor Placement
Not every component requires continuous measurement. Prioritize based on:
- Impact severity: Equipment failures that shut down production lines
- Failure frequency: Systems with recurring problems in maintenance history
- Operating criticality: Equipment supporting essential processes
- Age and condition: Older equipment approaching end-of-life
Maintenance teams working with 3G Electric typically identify 15-25 critical measurement points per facility as the optimal monitoring scope. This balanced approach captures meaningful data without creating excessive documentation burden.
Phase 3: Measurement Frequency and Scheduling
Establish a measurement schedule matching your operational needs:
- Daily measurements: Equipment with history of rapid degradation, newly repaired systems in warranty periods
- Weekly measurements: Systems supporting continuous production, high-value equipment
- Monthly measurements: Standard equipment, seasonal systems not currently in use
- Quarterly measurements: Backup systems, equipment with proven stability
Document measurements immediately to prevent data loss and ensure accuracy. Many facilities use smartphone photos of dial gauges combined with spreadsheet logging for simple, reliable record-keeping.
Phase 4: Alert Threshold Development
Meaningful thresholds trigger investigation without creating false alarms. Develop thresholds using:
- Manufacturer specifications: Use stated operating ranges as upper bounds
- Historical patterns: Trends revealing equipment degradation patterns
- Industry standards: Benchmark data from similar facilities
- Expert judgment: Input from senior maintenance technicians familiar with equipment behavior
Thresholds typically include:
- Normal range: Expected operating parameters (establish baseline ±5%)
- Caution range: Deviation requiring investigation within 1-2 weeks (baseline ±10-15%)
- Alert range: Immediate action required (baseline ±20%+ or manufacturer maximum)
Advanced Detection Techniques for Maintenance Teams
Trend Analysis: Detecting Gradual Degradation
The most valuable predictive maintenance information comes from trends rather than individual measurements. A temperature increasing 2°C weekly over six weeks suggests progressive bearing wear—information that single measurements miss entirely.
Maintenance teams should plot measurements on simple graphs (manually or digitized) to visualize trends. Gradual slopes indicate predictable failures allowing planned interventions. Sudden spikes suggest acute problems requiring emergency response.
Comparative Analysis: Cross-System Monitoring
When monitoring parallel systems (dual pumps, redundant cooling circuits), compare measurements between identical equipment. Temperature or electrical parameter differences between equivalent systems often indicate developing problems in the hotter or more resistant unit.
Seasonal and Operational Context
Temperature and pressure readings change with ambient conditions, production schedules, and seasonal factors. Maintenance teams must account for these variables:
- Equipment operates hotter during peak production periods
- Cooling systems require higher pressure during summer months
- Hydraulic systems show higher viscosity and slower response in cold weather
- Electrical measurements vary with ambient temperature
Effective predictive maintenance accounts for these normal variations while detecting abnormal deviations.
Integrating Measurement & Detection Into Daily Operations
Training Maintenance Staff
Measurement tools are only effective when operators understand proper technique. Training should cover:
- Correct thermometer placement for accurate readings
- Proper multimeter connection to avoid false readings
- Pressure gauge zeroing and calibration procedures
- Documentation protocols and data entry standards
- Threshold interpretation and when to escalate concerns
Invest 2-3 hours in initial training per technician, followed by brief refreshers quarterly. Cross-training ensures consistent measurement technique across all team members.
Integration With Maintenance Management
Measurement data becomes valuable only when integrated into decision-making processes:
- Schedule calibration service when bearing temperature increases 15°C above baseline
- Plan motor replacement when electrical resistance increases 20%
- Coordinate expansion tank service when pressure won't hold set value
- Investigate voltage imbalances suggesting imminent motor failure
Many facilities now use simple spreadsheet alerts (color-coding threshold violations) or software tools that automatically flag out-of-range measurements.
Documentation and Continuous Improvement
Maintain historical measurement records for at least three years. This data enables:
- Identification of seasonal patterns requiring technique adjustments
- Correlation between measurements and subsequent failures
- Benchmarking against industry standards and similar facilities
- Justification for equipment replacement or preventive investments
Conclusion
Measurement & Detection represents your maintenance team's most powerful tool for preventing equipment failure. By establishing baselines, implementing strategic measurement programs, and analyzing trends, facilities transition from reactive emergency repairs to planned preventive maintenance. With 35+ years of experience supporting maintenance teams globally, 3G Electric understands the practical challenges of implementing these systems and provides the reliable instruments necessary for success.
Starting a predictive maintenance program requires modest initial investment but delivers returns through reduced downtime, extended equipment lifespan, and improved operational reliability. Begin with your most critical equipment, master the measurement fundamentals, then expand your program systematically. The maintenance teams that embrace Measurement & Detection today will significantly outperform those relying on traditional reactive approaches.